TN2953-P The Josephson junction: Quantum tunnelling and interference in an electrical circuit
This document contains the basic info for the TN2953-P "SQUID Pracitcum" run via the Quantum Nanoscience department.
In addition to this document, there are also training videos and reading from the Feynman lecture with a undergraduate level derivation of the Josephson relations.
Contributors:
- Daniel Bothner
- Ines Corveira Rodrigues
- Jasper Franse
- Gary Steele
Introduction
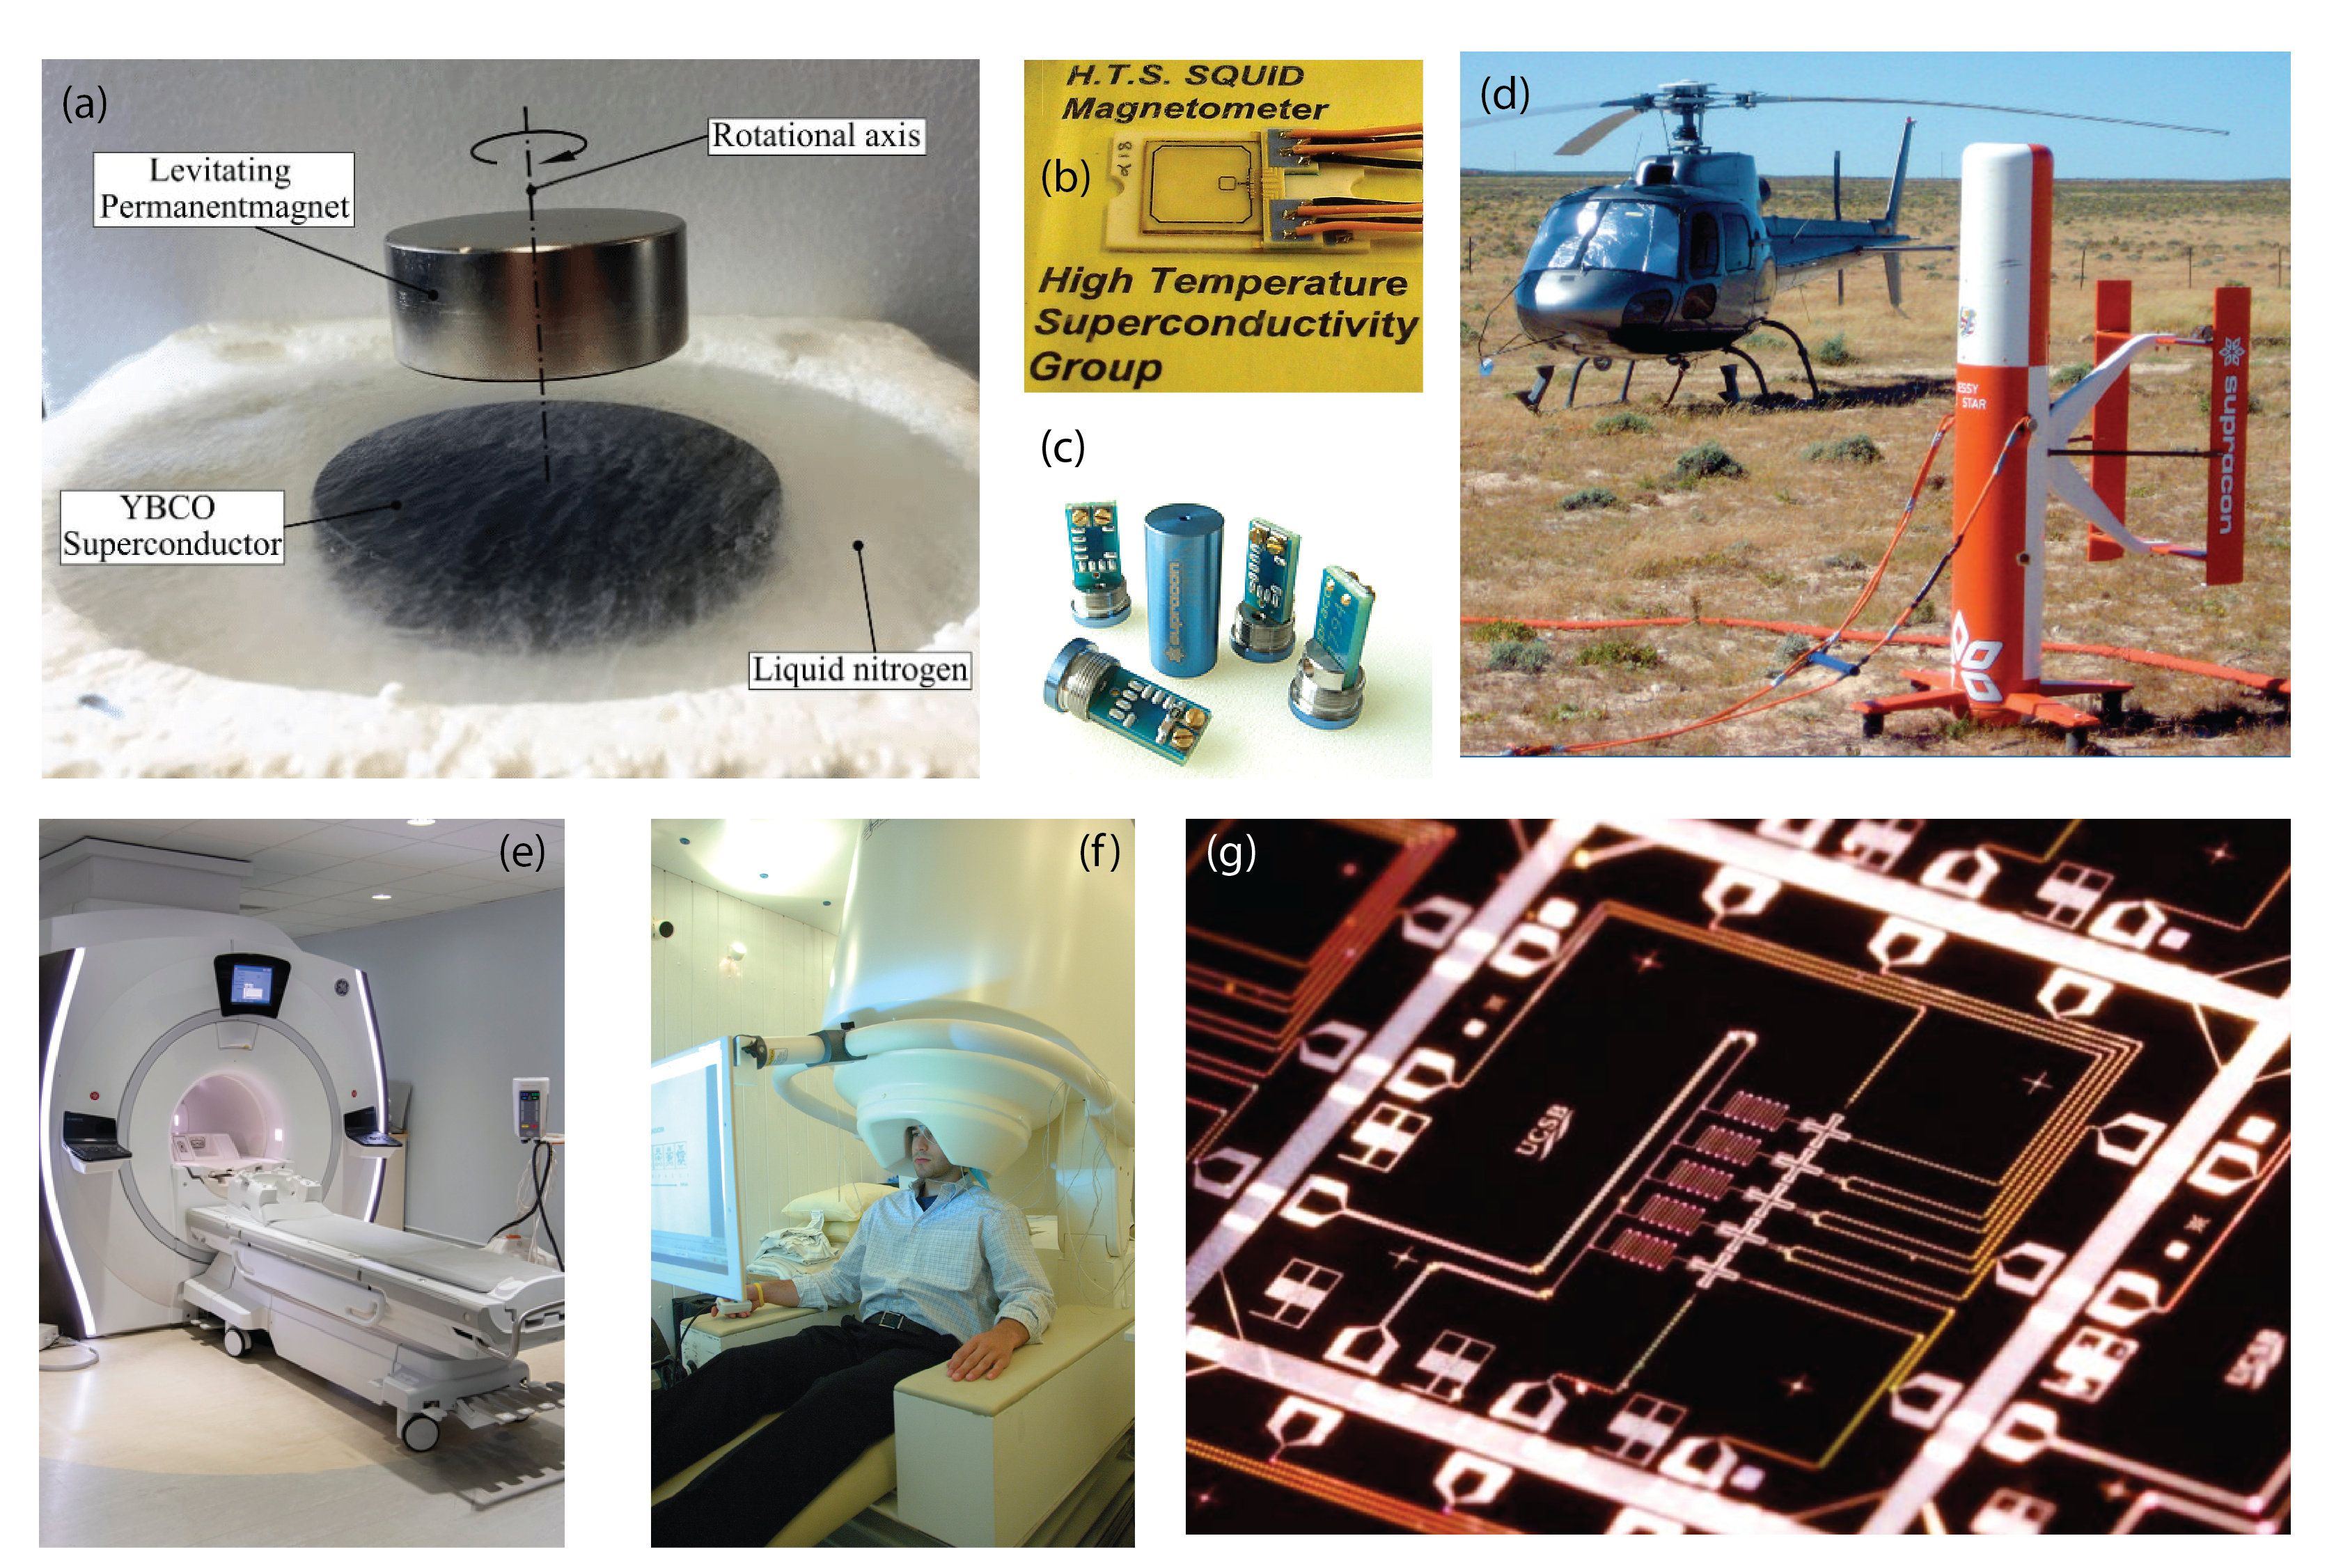
Examples of superconductivity (a) Meissner levitation of a permanent magnet above a high temperature superconductor (source. (b) A SQUID sensor for sensing magnetic fields (source. (c) A commercial SQUID sensor for detecting currents (source). (d) A commercial SQUID sensor for geological surveying (source). (e) An MRI scanner which uses superconducting magnets to generate larger magnetic fields (source) (f) A scanner based on SQUID for detecting electric currents in the neurons in a human brain (source). (g) A superconducting quantum computing chip (source).
Superconductivity was first discovered in 1911 in a sample of mercury metal that lost its electrical resistance just four degrees above absolute zero. The phenomenon of superconductivity has been the subject of both scientific research and application development ever since. The ability to perform experiments at temperatures close to absolute zero was rare in the first half of the 20th century and superconductivity research proceeded in relatively few laboratories. The first experiments only revealed the zero resistance property of superconductors, and more than twenty years passed before the ability of superconductors to expel magnetic flux (the Meissner effect) was first observed. Magnetic flux quantization - the key to the operation of superconducting quantum interference devices (SQUIDs) - was predicted theoretically only in 1950 and was finally observed in 1961. The Josephson effects were predicted (nobel prize for Brian Josephson in 1973) and experimentally verified a few years after that. SQUIDs, essentially two Josephson tunnel junctions incorporated into a superconducting loop, were first studied in the mid-1960s, soon after the first Josephson junctions were made. Practical superconducting wire for use in moving machines and magnets also became available in the 1960s. For the next twenty years, the field of superconductivity slowly progressed towards practical applications and to a more profound understanding of the underlying phenomena. A great revolution in superconductivity came in 1986 when the era of high-temperature superconductivity began (nobel prize 1987 for Bednorz and Mueller). The existence of superconductivity at liquid nitrogen temperatures ($T \approx$ 77 K) has opened the door to applications that are simpler and more convenient than what has ever been possible before. Nevertheless, the product you have in your hands today was made possible by many aspects of the more than 100 years of discovery that preceded it. Today, there is a wide variety of fields where SQUIDs are applied in, as for example for electrical measurements, thermometry, magnetic field sensors, geophysical measurements, biomagnetism and more recently for quantum science and quantum information technology.
Theory
Note: This section contains a basic introduction to the theory, which you can read as a pre-introduction to the material of the Feynman lectures, which you can find here.
Superconductivity
There are certain materials -- actually, many thousands of them by now -- that exhibit a remarkable transition in their ability to pass electrical currents: when they are cooled down to a sufficiently low temperature, the value of which depends on the material, their electrical resistance completely vanishes. How this behaviour comes about was a mystery that occupied the minds of theoretical physicists for nearly half a century after it was first observed. The answer turned out to be tied to the quantum-mechanical nature of solids, in particular, to the tendency of electrons to become paired. All of these so-called "Cooper pairs" behave cooperatively and form a single quantum-mechanical state.
When the temperature is extremely low, the highest energy level which is occupied with free electrons in a normal metal is known as the Fermi level. As the temperature starts to increase, these electrons will undergo excitations due to this increment over an energy range of $k_\mathrm{B}T$, leading to thermal occupation of energy levels above the Fermi level ($k_\mathrm{B}$ in the given expression is the Boltzmann constant and $T$ the temperature). This zone is called conduction band and its electrons are responsible for transporting electrical charges. When there is a flow of a current in the metal, or, in other words, when there is movement of electrical charges, the electrons will interact with the ions of the crystal lattice, causing displacements of their lattice positions by Coulomb interaction and hereby generating vibrational waves (phonons). These processes are mainly responsible for the resistive behaviour of metals and the decrease of energy of their conducting electrons.
When it comes to superconducting materials, the situation is different and their behaviour can be explained based on the BCS theory (named after the theoretical physicists Bardeen, Cooper and Schrieffer, nobel prize in 1972). All superconductors have a transition temperature $T_c$, at which their behaviour undergoes a big switch-over. Below this temperature ($T < T_c$) the electrons in the conduction band fomr pairs known as Cooper-pairs or BCS pairs. In this case all the pairs are described by a single quantum-mechanical wave-function and there is no interaction with free electrons. For this reason there is no energy loss while interacting with the lattice (in the particle picture each scattering event is compensated by an opposite event of the Cooper partner) and there is no sign of an Ohmic behaviour when there is flow of a current (this is then called a supercurrent).
Superconducting Rings
A closed superconducting ring is a particularly convenient system to study for understanding the properties of superconductors. It is also the basis of the SQUID. Consider the following experiment. We cool a ring of superconductor in a small magnetic field that corresponds to one flux quantum ($\Phi_0 = h/2e \approx 2.067 \cdot 10^{-15}\,$Wb) threading the ring. (The magnetic flux through a loop area $A_l = \pi r^2$ in a homogeneous perpendicular magnetic field $B$ is given by $\Phi = B\cdot A_l$). We now have a superconducting ring threaded by a single flux quantum. Suppose we now turn off the applied field. According to Faraday's law of induction, the moment that we change the flux threading the ring, a current flows around it. This current tries to oppose the change in magnetic field by generating a field to replace the flux we removed. In an ordinary metal, that current would rapidly decay due to Ohmic dissipation. In a superconductor, something entirely different happens. If the induced current decreased just a little bit in the ring, then the flux threading the ring would be a little less than a flux quantum. This is not allowed. The next allowable value of flux would be zero flux. Therefore, the current would have to abruptly cease rather than decay away. Because the superconducting state is composed of an enormous number of electrons that are paired up and occupying the same quantum state, a current reduction of the sort needed would require all the electrons to jump into another state simultaneously. This is an extraordinarily unlikely event. Practically speaking, it will never happen. As a result, the current induced in a superconducting ring will flow infinitely long. People have actually tried this experiment for years on end. As long as the ring is kept cold, the current flows without resistance.
Josephson Junctions
The Josephson effect is yet another manifestation of what we call the long-range quantum coherence of superconductors. The simple picture of this is as follows: Two regions of superconducting material are placed very close to one another as shown in Fig. 2.1.
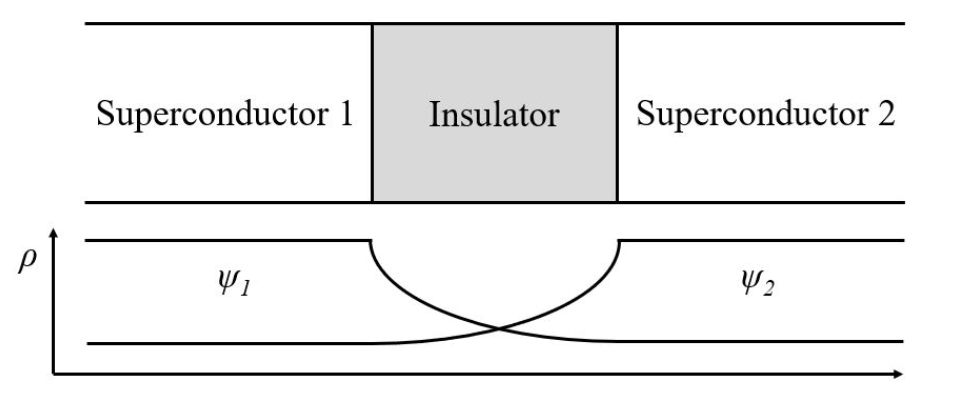
Figure 2.1: Schematic diagram of two superconducting regions separated by a thin gap
In both regions, the superconductiong charge carriers are described by a quantum wave function $\Psi_i = |\Psi_i|e^{i\phi_i}$ with an amplitude $|\Psi_i|$ and a quantum phase $\phi_i$ ($i = 1, 2$). The phase on the left side of the gap is $\phi_1$ and on the right side it is $\phi_2$. In a single piece of superconductor, the phases at two different positions have a specific relation to one another (macroscopic phase coherence). This arrangement assures a lower energy ground state that results in superconductivity.
In the picture of Fig. 2.1, what will the phases of the two superconductors do? As quantum mechanics predicts that the wave functions do not abruptly decay to zero at the boundary of the superconductors, but slightly extend into the outside region with an exponential decay. Thus, the wave functions of the two pieces will overlap in the gap region and the surprising answer to the above question is that if the gap region is small enough, $\phi_1$ and $\phi_2$ will be related. Practically speaking, this means that Cooper pairs from one superconductor can tunnel through the gap into the second and vice versa. In other words, the two superconductors will essentially act like a single one, but with a small region where the ability to carry a supercurrent is reduced. Still, electrical (tunnel) currents can flow between the two regions with zero electrical resistance. Such tunnel currents are called Josephson currents and physical systems composed of two regions of superconductor connected via such a weak link are called Josephson junctions. Strictly speaking, the resistance-less currents that flow in a Josephson junction are a manifestation of the DC (direct current) Josephson effect; a second property of Josephson junctions by which the Cooper pair current oscillates with high frequencies through the gap is called the AC (alternating current) Josephson effect.
A common way to make Josephson junctions is to separate two superconductors by a very thin (1-2 nm) insulating layer, a technique frequently used with lower temperature superconductors, such as Aluminium ($T_c = 1.2$ K) and Niobium ($T_c = 9.1$ K). This type of junction is called a Superconductor-Insulator-Supercondcutor (SIS) junction. In this practicum we will work with a high temperature supercoductor called YBCO with $T_c \sim 90$K. While the $T_c$ is very high, these materials are very difficult to deposit and there is no easy way to make SIS junctions. Instead, people discovered that you can make a Josephson junction by using grain boundaries that can form during crystal growth.
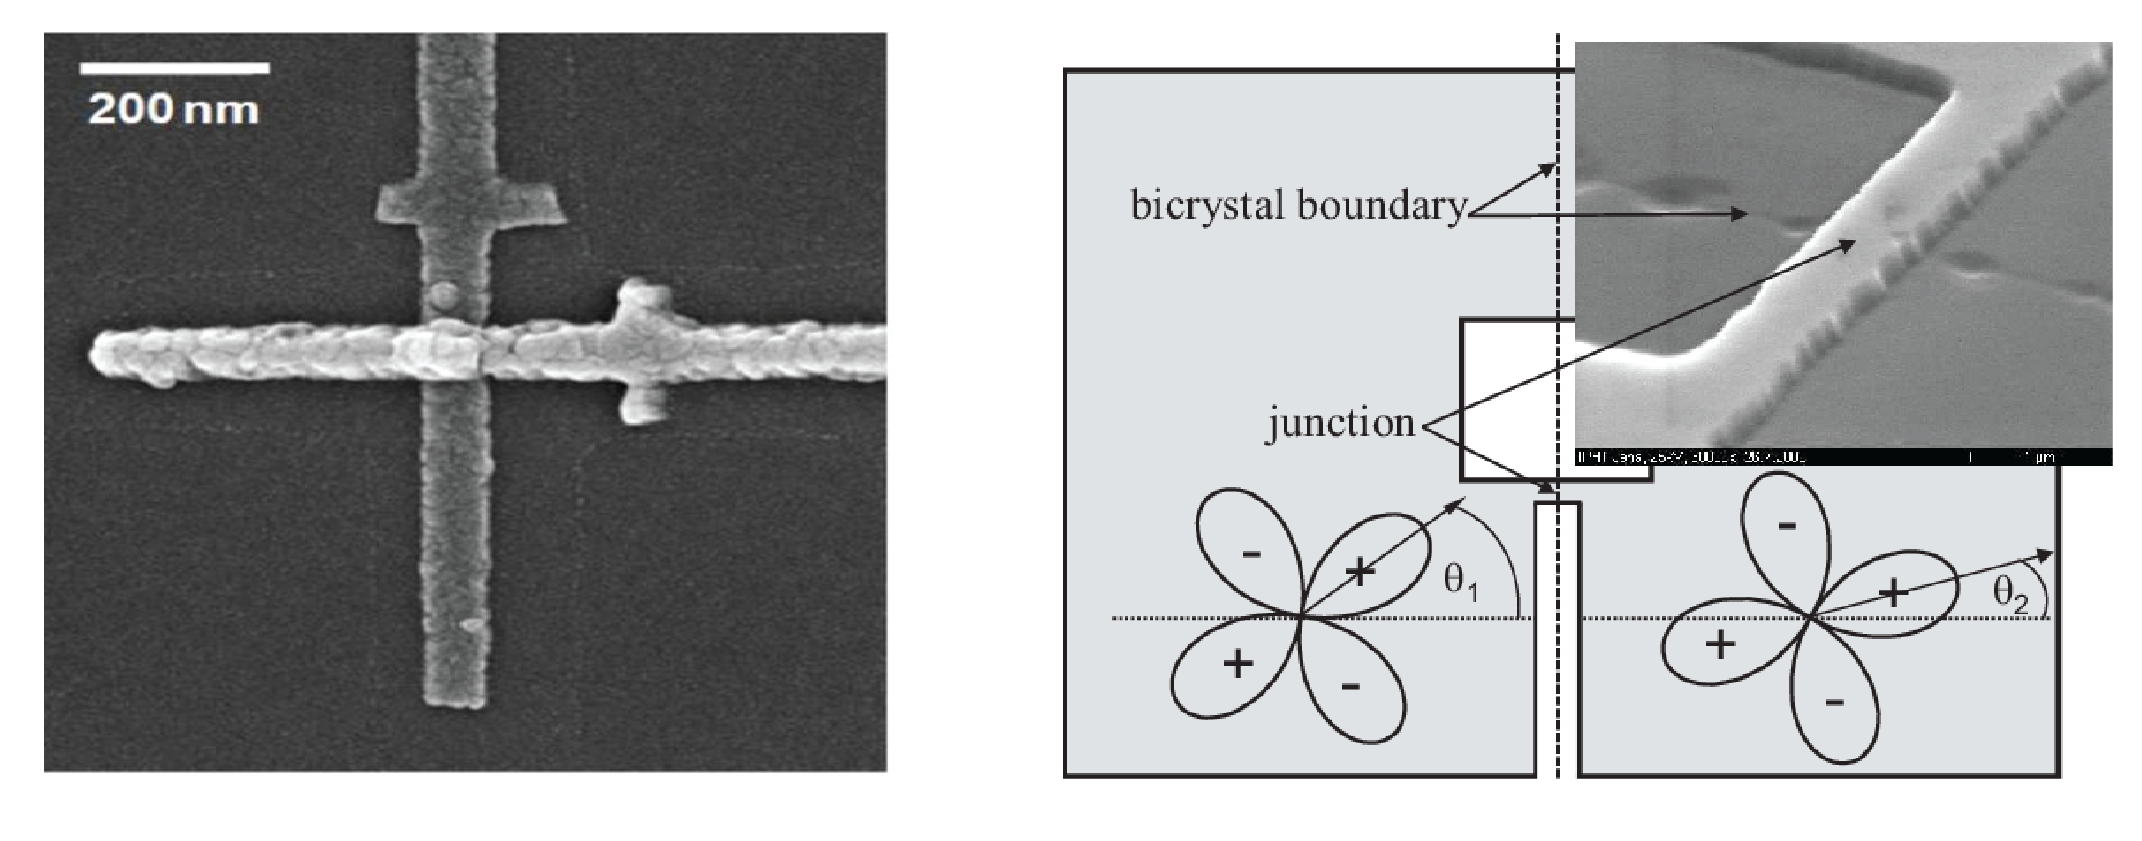
Examples Josephson junctions: Left shows an Al SIS junction (source). Two layers are deposited from different angles with short oxidisation step in between. Right shows a YBCO junction in which a "natural" Josephson junction forms in the YBCO film when it grows on top of a crystal grain boundary that is present in the substrate (source).
Josephson junctions are the essential active devices of superconducting electronics, much as the transistor is the essential active device of semiconductor electronics. Junctions can be used in a variety of electronic circuits as switching devices, sensors, variable inductors, oscillators (because of the AC Josephson effect), and other applications. People have built Josephson electronic circuits that contain up to a million junctions. At the opposite extreme, one of the most useful circuits made from Josephson junctions is the DC SQUID, which contains only two junctions.
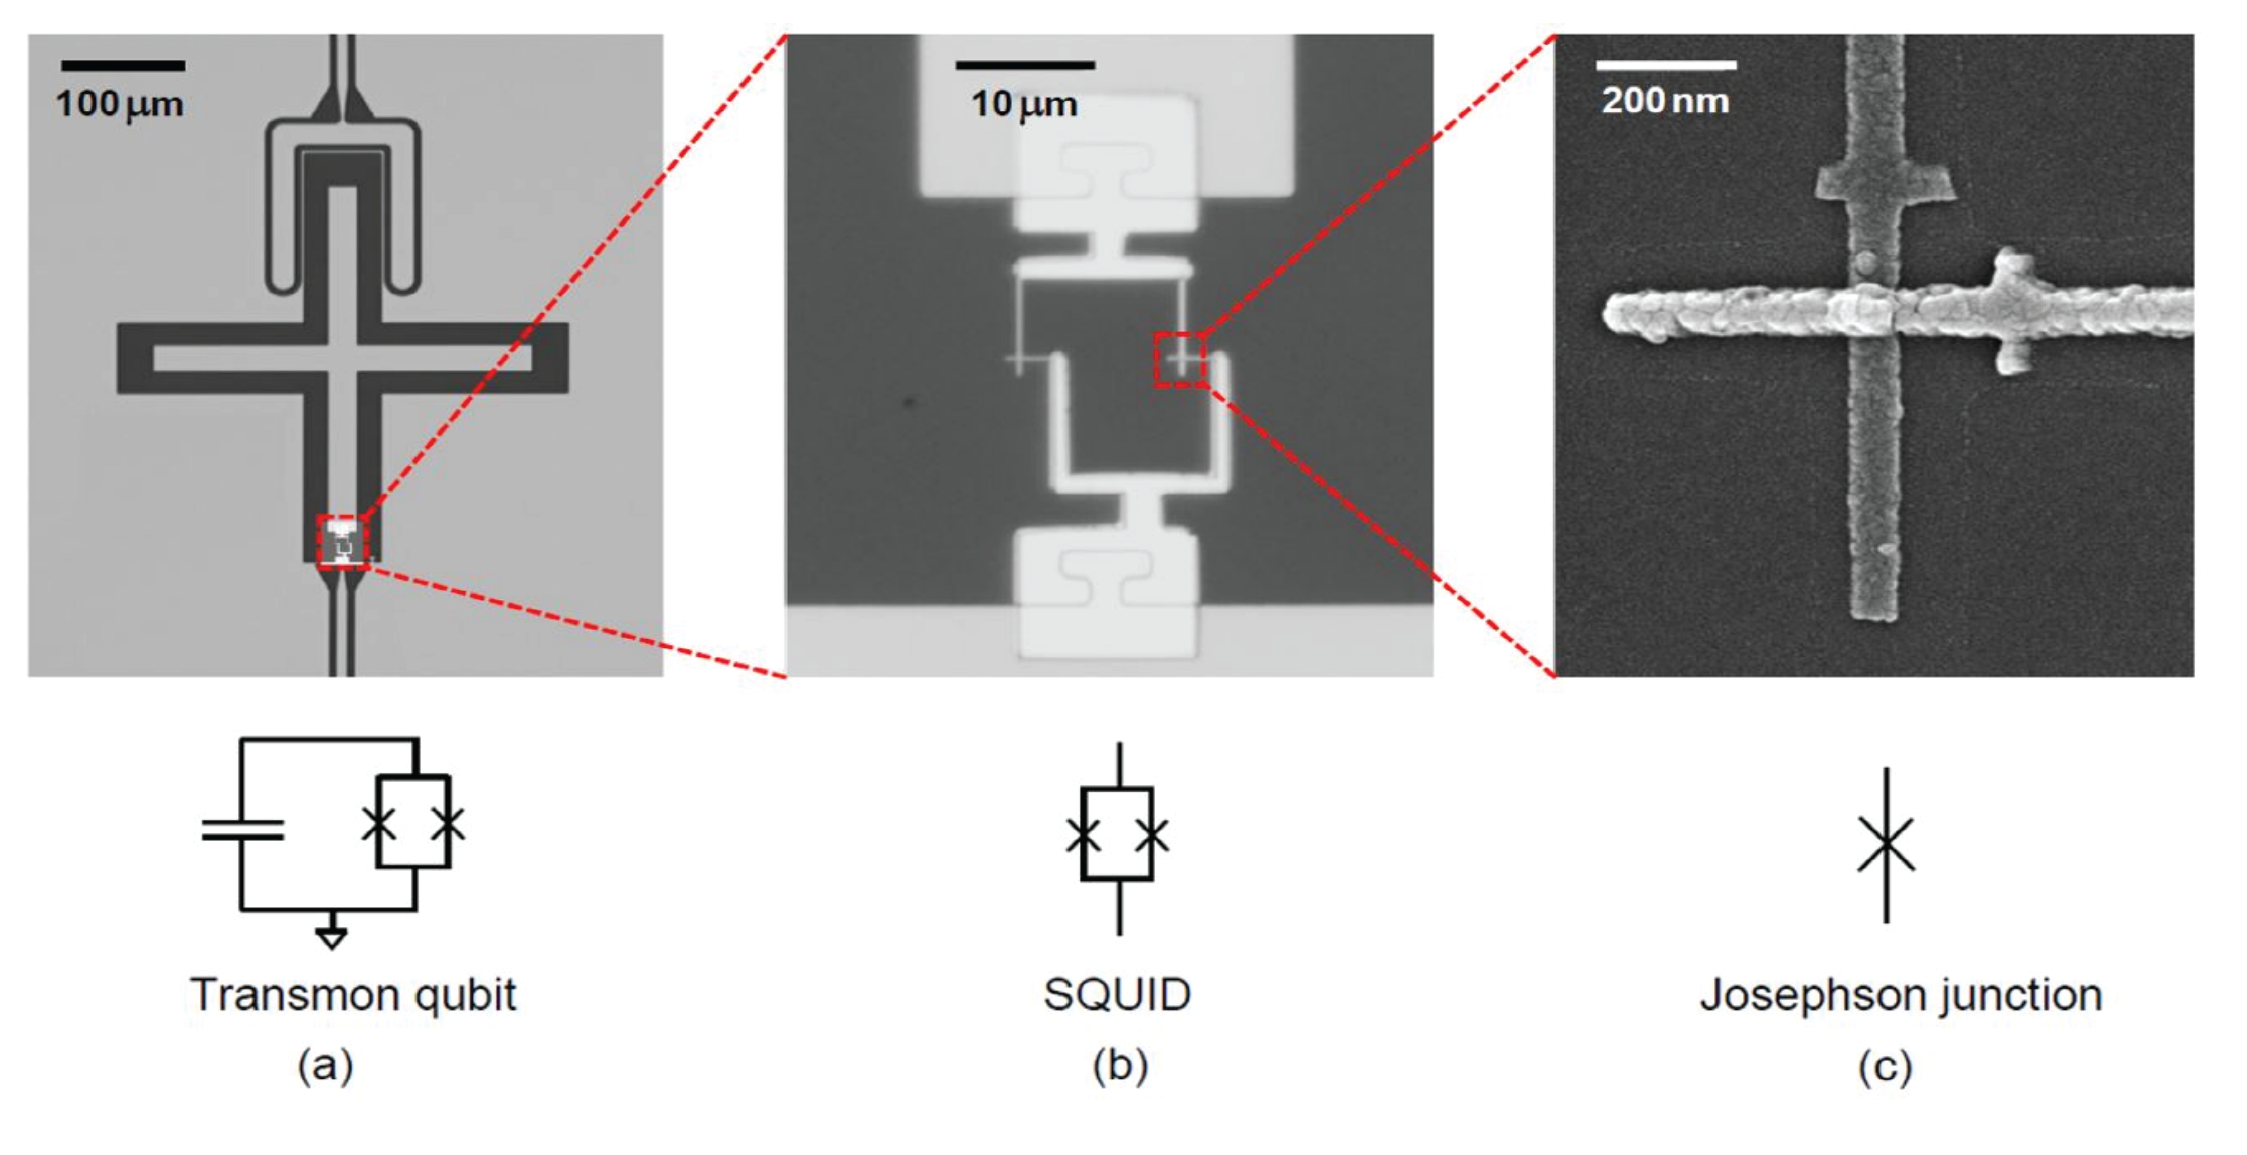
A superconducting qubit based on Josephson Junctions A superconducting qubit is made by shorting a loop containing two Josephson junctions by a large capacitance (source). In this type of device, the Josphson junction plays the role of a nonlinear inductor with a non-constant quantum level spacing of the circuit. This forms what is called a "transmon qubit", the type of qubit used in the quantum computers of Google and IBM.
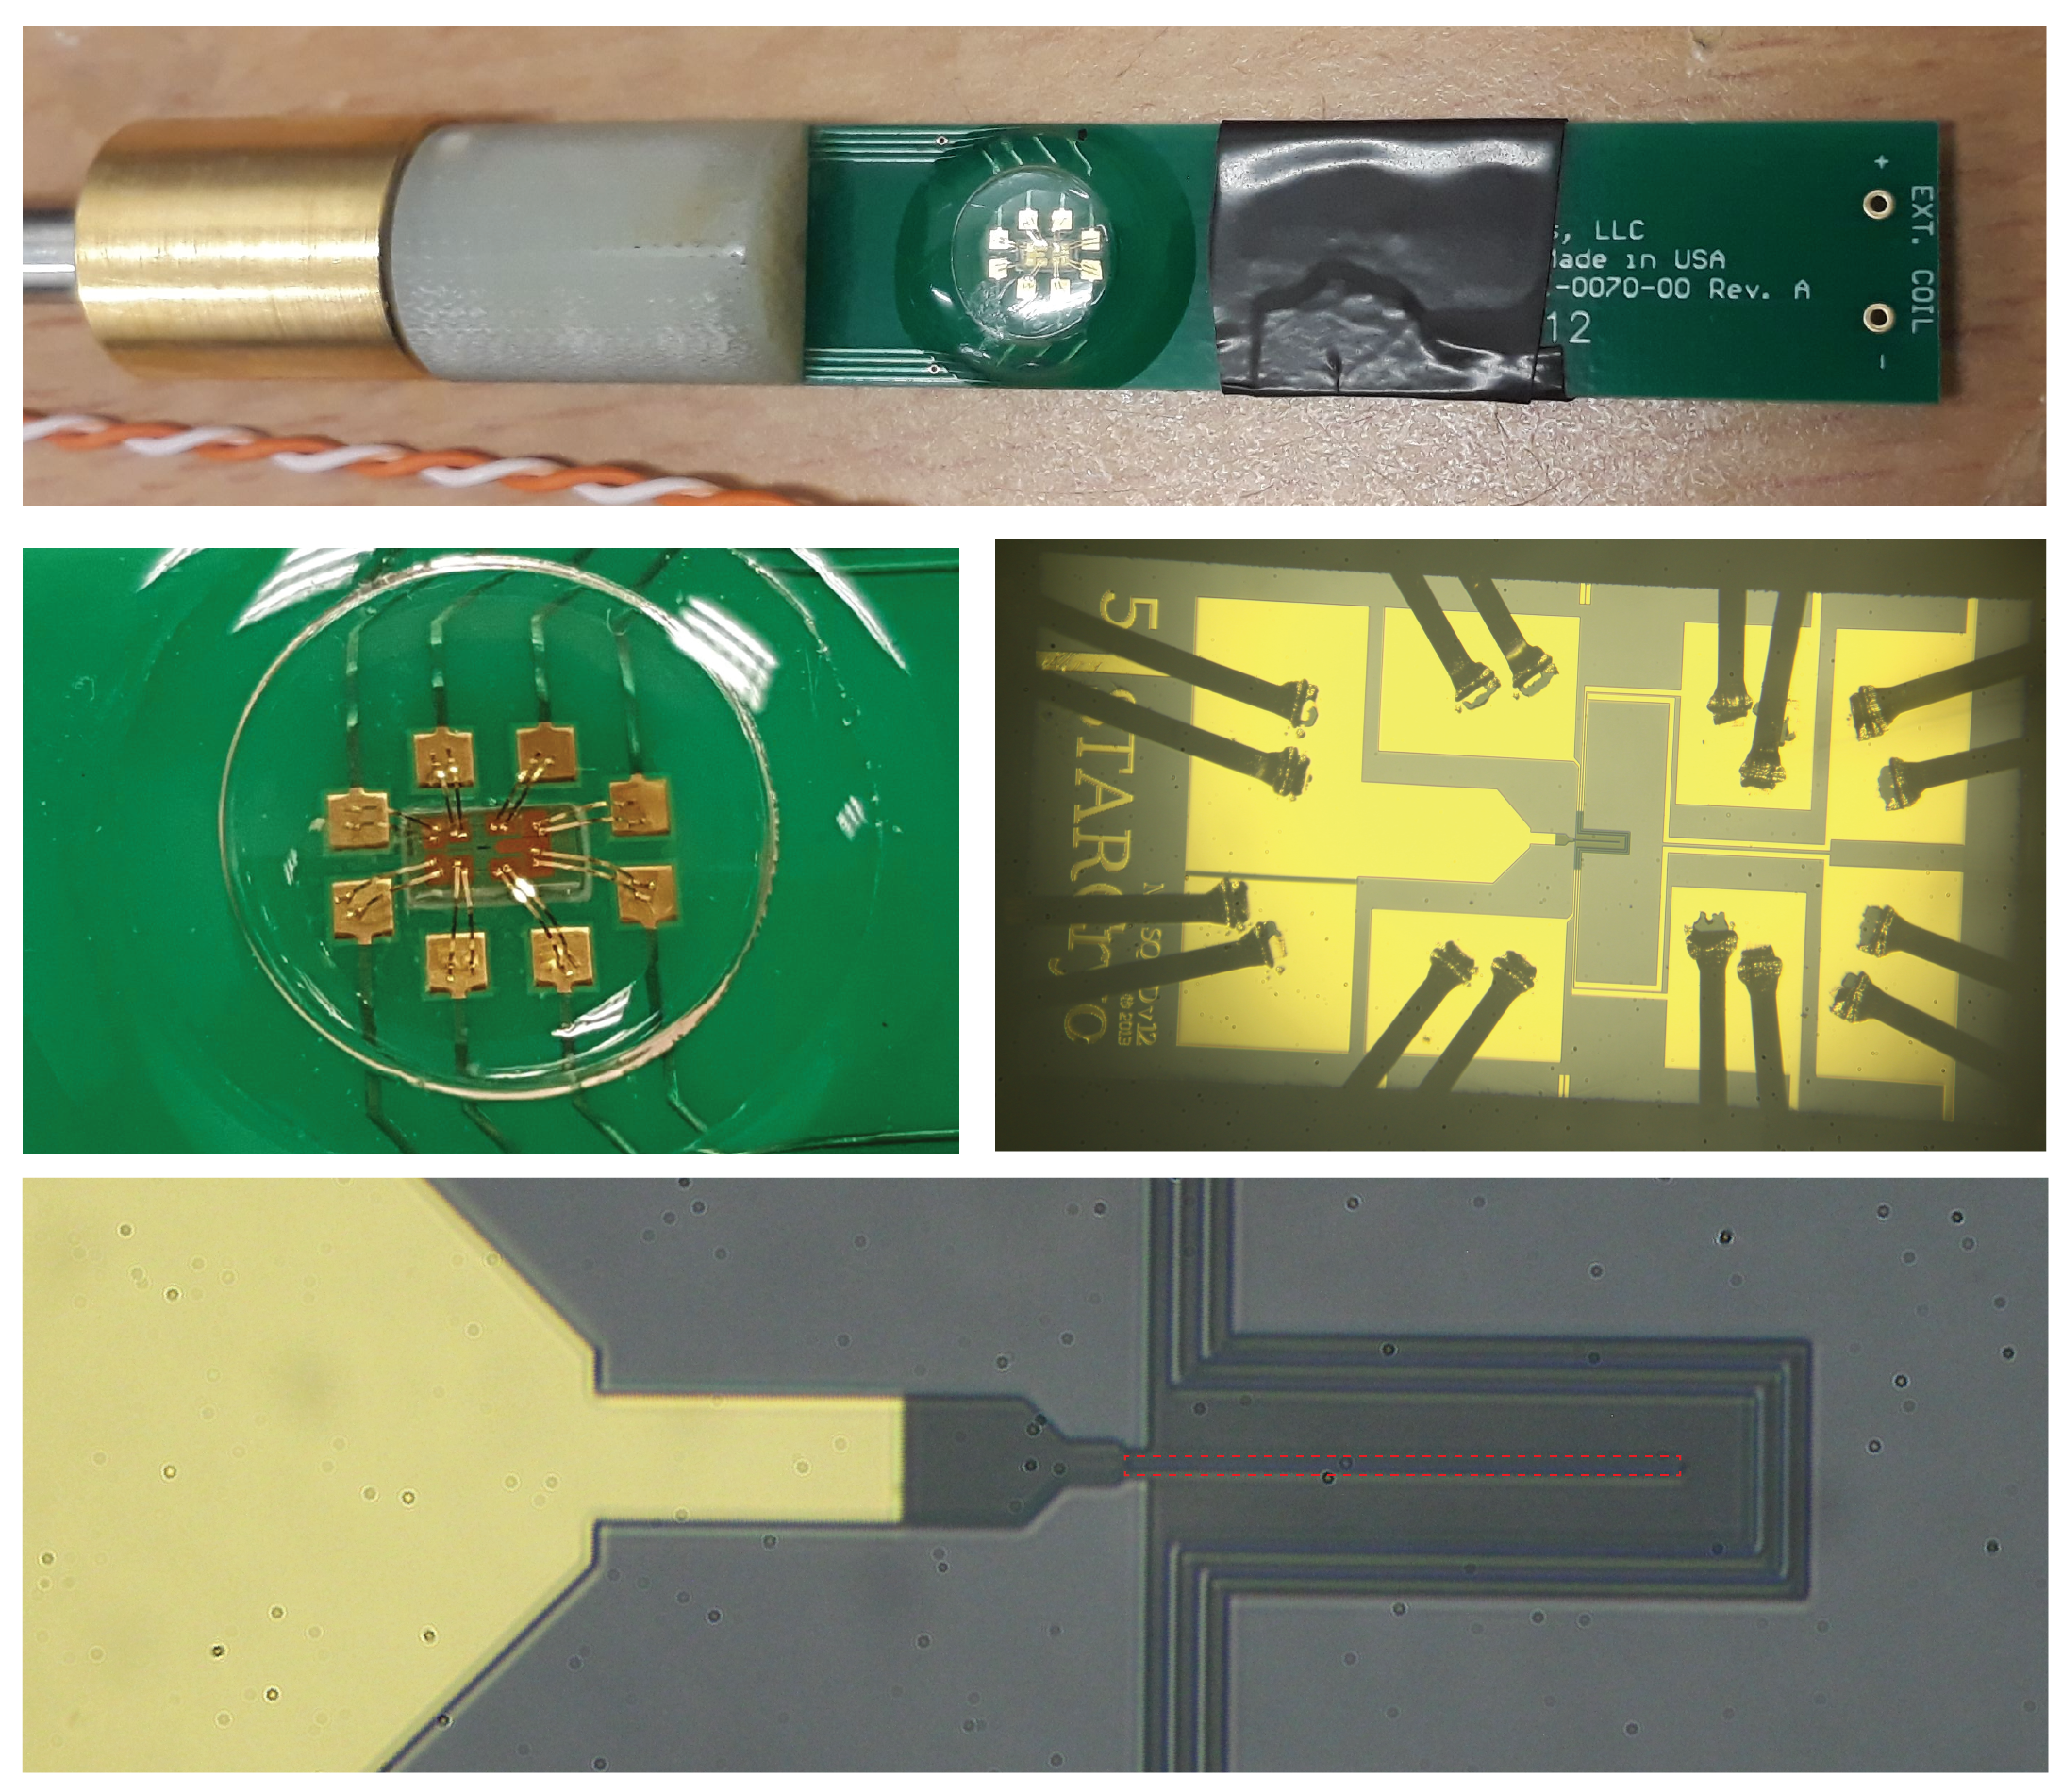
The SQUID used in this setup The SQUID used this setup. The red dashed box indicates the area of removed superconductor that creates the loop in the SQUID.
DC and AC Josephson Effects
In the experiments we will be doing, we will apply currents across Josephson junctions and measure the voltage that results across it. Because of the tunneling of Cooper pairs, it will be possible to have a current flowing through the junction even though there is no voltage across it: even though there is a tunnel barrier, where classical electrons would not be allowed all, due to quantum mechanical tunneling of the Cooper pairs, current can flow without any voltage! This is called the "zero resistance state" of the junction.
If there is no voltage across our device, what determines the current flowing through it? It turns out that this is a interesting problem to solve. It was first studied by Brian Josephson when he was a PhD student, and the result is strange: the current that flows is determined by the difference in the phase of the macroscopic wave function of the electrons in the two pieces of superconducting metal on either side of the junction! For a relatively simple (seeming) derivation of this at the level of undergraduate quantum mechanics, you can have a look at the Feynman lectures linked above.
If the current is determined by the phase difference, what sets the voltage across the junction?
It turns out that the voltage is set by the rate at which the superconducting phase difference changes in time. The exact relations between these three (the current, the voltage, and the phase difference) are called the "Josephson Relations". With the phase difference $\delta = \phi_2 - \phi_1$, the two Josephson relations are given in the following two equations:
\begin{eqnarray} I & = & I_c\sin{\delta} \tag{2.1}\\ V & = & \frac{\hbar}{2e}\frac{d \delta}{d t} \tag{2.2}. \end{eqnarray}
Again, if you are interested in seeing where these come from, they are derived in a pretty simple (but somewhat subtle) way in the Feynman lectures.
Note that because the voltage is proportional to $d \delta / dt$, you can quickly see that these equations predict the possiblity of current with no voltage. If $I < I_c$, then one can find a solution with a time-independent phase difference $\delta$ that solves the first equation. And then, from the second equation, we see that $V = 0$.
But wait a minute: how do I know what the superconducting phase difference is when I'm working in the lab? Can I "set" it? Or can I measure it? Do we have a piece of equipment in the lab called a "superconducting phase difference meter"?
The answer to this is no: in our experiments, we only apply a (DC) current and measure the resulting (DC) voltage. In that sense, in the equations above, the superconducting phase is an implicit variable: we do not know it, but we can imply what it is doing from our measurements. For example, if we know that we somehow manage to get a current I flowing through the junction, the phase difference must be equal to $\arcsin(I / I_c)$. $I_c$ itself is a parameter that depends how the junction is made: what kind of superconducting, how big it is in area, how thick the tunnel barrier is. For example, a smaller tunnel barrier will give more wave function overlap and a larger $I_c$, and similarly, a larger area overlap of the junction will also give a larger $I_c$.
Note also that not all values of I are possible: the sine function above shows you that the tunneling of Cooper pairs cannot exceed a value $I_c$. For this reason, $I_c$ is known as the critical current, the current at which Copper pair tunneling is no longer able to carry current across the junction.
What happens if you try to apply a current that is larger than $I_c$? In a real junction, what will typically happen is that current will start to flow due to other sources of charge in your metal. At non-zero temperature, not all the electrons in your superconductor are "paired". These unpaired electrons (called "quasiparticles") obey Ohm's law, and therefore if a voltage starts to build up across the junction, then that voltage can start to make these non-superconducting electrons flow, which is something that (frequently) happens if you try to exceed the critical current.
While the Josephson relations above look mathematically simple, they are trickier to understand than when you first look, since they correspond to non-linear coupled differential equations. It turns out, however, that there are some nice intuitive pictures for understanding the solutions to these equations.
In particular, one can map these equations to the physical behaviour of a particle in a sinusoidal potential, a so-called "washboard potential" (see here on wikipedia for some more info):
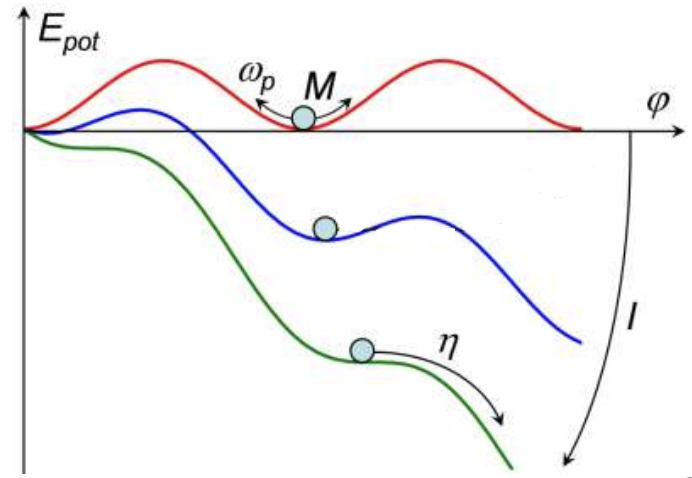
Figure 2.2: The "washboard" potential To understand the dynamics of the currents and voltages across a Josephson junction, one can visualise it by considering a mass sliding in a "washboard" cosine potential, which has "bumps" like the boards used in the past for washing clothes. The "position" of the particle is interpreted as the phase across the junction. With no external current (red), the particle sits stationary at a minimum of the potential: since the velocity $d\phi / dt$ is zero, there is no voltage. And since the position is a multiple of $2 \pi$, the current is zero. Adding a external current adds a linear slope to the potential energy (blue and greeen). For currents smaller than the critical current (blue), this position of the minimum shifts: the equilibrium phase is no longer a mulitple of $2 \phi$ and so the current is no longer zero according to $I = I_c \sin(\delta)$ but the velocity, and therefore voltage, is still zero. For currents above the critical current (green), there is no longer a minimum: the particle escapes and startes sliding down the potential. As it slides the average velocity is no longer zero, and so the voltage across the junction is no longer zero as well: it no longer allows current to flow with no voltages. (source)
For a junction which is not biased with a current or a voltage, the potential energy landscape is a cosine potential as shown in Fig. 2.2 (a). To understand what happens, you should imagine dropping a marble into the washboard, letting is roll until it loses is energy from some friction, and then see what it's equilibrium position is. Doing this, you can see that the ball will come to a rest at $\delta = 0$ (or, actually any multiple of $2\pi$. The particle position in this model corresponds to the phase difference across the junction $\delta$, and using the equations above, we can see that the current across the junction is zero. Similarly, once it is at rest in equilibrium, the phase is not changing, and the voltage across the junction is zero.
When we apply a DC current to the Josephson junction, the potential in this model experiences a tilt as shown in Fig. 2.2 (b). Even though a current is flowing through the junction now, however, the particle is still trapped in the potential minimum at a constant phase difference given by the first Josephson relation and its velocity is zero. Thus, there is no voltage drop across the junction, which corresponds to a dissipationless current flow, with the current being determined by how much the minimum of the tilted cosine has shifted to the right.
Important is that the tilt of the potential increases if you increase the externally applied current. So if we keep increasing the current through the junction, the potential will tilt further and further up to a point when the well trapping the particle vanishes and the particle starts to roll down the hill. If the particle experienced no friction, it would keep rolling faster and faster down the hill. However, in practice, due to (for example) the non-paired electrons in the junction, the particle experiences some friction when it is moving and will reach a "terminal velocity" for a given applied current. This critical tilting point is called the critical current $I_c$ of the Josephson junction and above this value, a voltage will drop across the junction.
A typical current-voltage characteristic of a Josephson junction obtained by sweeping the current is shown in Fig. 2.3:
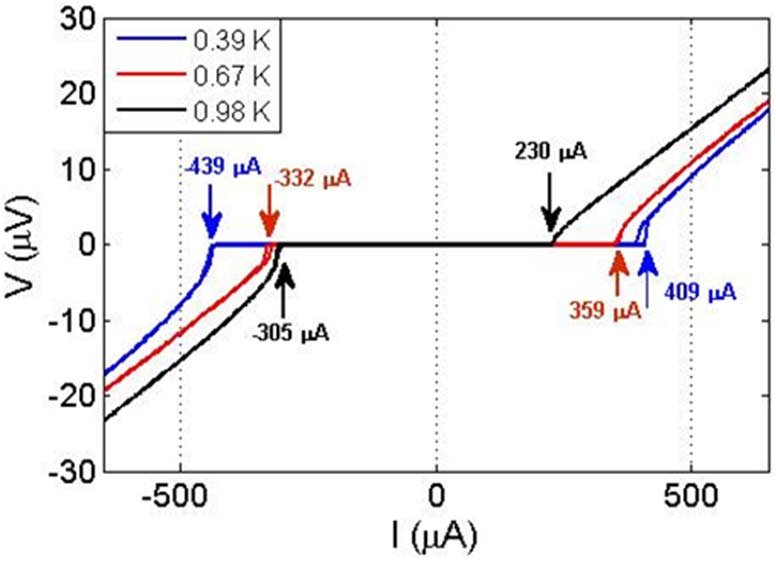
Figure 2.3: An example of an IV curve of a Josephson junction This curve comes from a Josephson Junction based on low temperature superconductors. For small currents below the critical current, the junction allows current to flow without voltages. When the current exceeds the critical current, there is a jump and/or smooth transition to state where the voltage across the junction follows the linear relation expected for a normal resistor. If the temperature is increased and approaches the transition temperature of the superconductor, the critical current of the junction decreases.
Here, you can see the "zero voltage state" at low applied external current when we do not exceed the critical current, followed by a "kink" as we exceed the critical current as the marble rolls out of the potential minima it was trapped in.
Above this critical current, the particle has started rolling down the hill, reaching a constant (average) critical velocity, corresponding to an average measured DC voltage. Note that the marble is still rolling over the "wobbles" of the tiled washboard: in addition to this non-zero average velocity, it will also still speed up and down a bit as it goes over these wobbles. These wobbles will actually lead to oscillations of the voltage, but these occur at very high frequencies (GHz to THz) and so we will not be able to measure them with our equipment (which can only measure up to 500 Hz or so).
Finally, at high enough external current, the particle no longer feels the wobbles: the voltage is now constant and the current is now carried in practice nearly entirely by the unpaired, non-superconducting electrons.
The DC SQUID
A SQUID consists of two Josephson junctions connected in parallel in a superconducting loop, illustrated here:
Figure 2.5: A schematic representation of a DC SQUID with a magnetic flux crossing it
As we have said above, a fundamental property of superconducting rings is that they enclose magnetic flux only in multiples of a universal constant called the flux quantum. Because the flux quantum is very small, this physical effect can be exploited to produce an extraordinarily sensitive detector for changes in magnetic field (or anything that can be converted into a change of magnetic field) known as the Superconducting QUantum Interference Device, or SQUID.
In the case of no magnetic field applied to the SQUID, the maximum DC supercurrent which can be carried by the SQUID is just twice the critical current of a single Josephson junction (for the case of identical junctions). Assuming now that a magnetic field $B_a$ is applied to this system (see Fig. 2.5) and remembering the flux quantization insuperconducting loops, it is easy to understand that a screening current will circulate around the SQUID loop, which is also going through the Josephson junctions. The relationship between the phase differences across the two junctions, $\delta_1$ and $\delta_2$, can be written as
\begin{equation} \delta_2 = \delta_1 - 2\pi\frac{\Phi}{\Phi_0} \tag{2.4} \end{equation}
with the flux $\Phi = B_a A_l$ and $A_l$ being the SQUID loop area.
The total current through the junctions is given by
\begin{eqnarray} I_t & = & I_1 + I_2 \tag{2.5}\\ & = & I_{c1}\sin{\delta_1} + I_{c2}\sin{\delta_2} \tag{2.6} \\ & = & I_{c1}\sin{\delta_1} + I_{c2}\sin\left(\delta_1 - 2\pi\frac{\Phi}{\Phi_0}\right) \tag{2.7} \end{eqnarray}
where $I_{c1}$ and $I_{c2}$ are the critical currents of the two junctions. We can now obtain the value for the maximum zero-voltage current by maximizing the previous equation with respect to $\delta_1$ and get
\begin{equation} I_{ct}(\Phi) = \sqrt{(I_{c1} - I_{c2})^2 + 4I_{c1}I_{c2}\cos^2{\left(\pi\frac{\Phi}{\Phi_0}\right)}}. \tag{2.8} \end{equation}
Assuming two identical junctions $I_{c1}=I_{c2}=I_c$, we get
\begin{equation} I_{ct}(\Phi) = 2I_c\left|\cos{\left(\pi\frac{\Phi}{\Phi_0}\right)}\right|. \tag{2.9} \end{equation}
Thus, the critical current of the SQUID periodically modulates between $2I_c$ and $0$ with a periodicity of one flux quantum. As conclusion, it is allowed to say that the applied magnetic field has lowered the critical current of the SQUID, i.e., has reduced the maximum amount of bias current that can pass through the ring without generating a voltage. Additionally, when one of the junctions goes to the resistive state, all the current would have to pass through the other one, making it go resistive as well. At this point both of the junctions are resistive and a voltage can be detected across the SQUID terminals.
Another situation worth being described here is what happens when the magnetic flux is increased from zero to illustrate the periodic behaviour. In this case the screening current increases as well keeping the total flux at $0\Phi_0$, until it is energetically favorable for the SQUID to let one flux quantum into the loop and switch the direction of the screening current to fulfill $\Phi = 1\Phi_0$. When the magnetic flux is then further increased towards one external flux quantum, the screening current decreases until one full flux quantum is applied and the screening current is zero. This pattern repeats then with the periodicity of $\Phi_0$, the resulting current is plotted in Fig. 2.6.
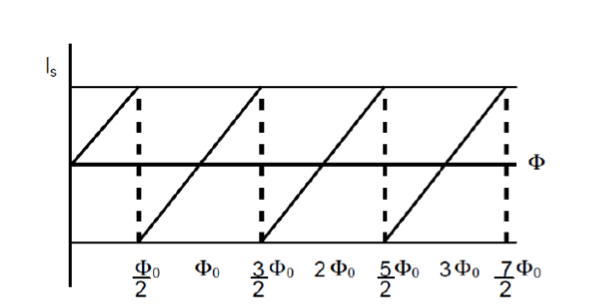 Figure 2.6: Variation of the screening current of a SQUID with the magnetic flux
Remembering that the critical current depends on the screening current, and knowing that this last on has a periodic dependence on external magnetic flux, we conclude once again that the critical current shows a periodic modulation with magnetic flux as well. As illustrated in Fig. 2.7, this modulation of the critical current can be used to detect small changes of magnetic flux by biasing the SQUID above the critical current and measure the voltage across it.
 Figure 2.7: Modulation of the voltage across a SQUID with the magnetic flux
When the critical current is changing, also the voltage at a fixed bias point slightly above the critical current changes due to the nonlinear I-V characteristics in this regime. Thus, also the voltage in the resistive state will show a periodic modulation with external flux.
Experimental Setup
In this section, we describe in more detail the components of the experimental setup you will be using.
Mr. SQUID probe
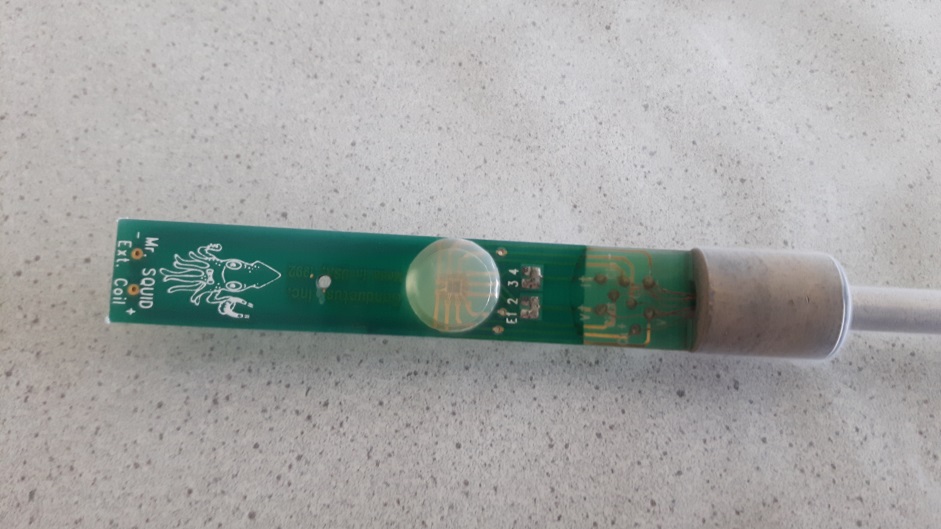
Figure 3.1: Mr.SQUID probe
Mr. SQUID is a DC Superconducting QUantum Interference Device (SQUID) magnetometer incorporating a high-temperature superconductor (HTS) thin-film SQUID chip, two feedback coils to modulate the SQUID and to couple an external signal to the SQUID, a cryogenic probe with a removable magnetic shield, an electronic control box containing all the circuits needed to operate the SQUID, and a cable to connect the probe to the electronics box. The probe is designed to be immersed in a liquid nitrogen bath that should be provided by the supervisors.
You can find more pictures of what the probe and chip look like in Teams:
Red Pitaya
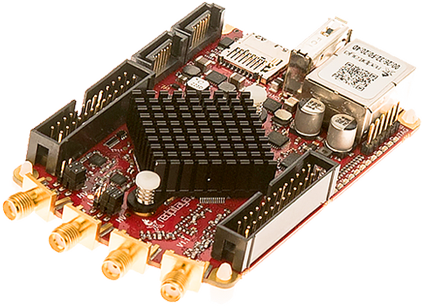
Figure 3.2: Red Pitaya
The Red Pitaya is an open-source hardware project intended to be alternative for many expensive laboratory measurements and control instruments. Here, the Red Pitaya is programmed with Python to sent over signals to the SMA (SubMiniature version A) output ports and receive the data from the Mr. SQUID probe back at the SMA input port.
Extra information can be found on their website: https://www.redpitaya.com/
Arduino Due
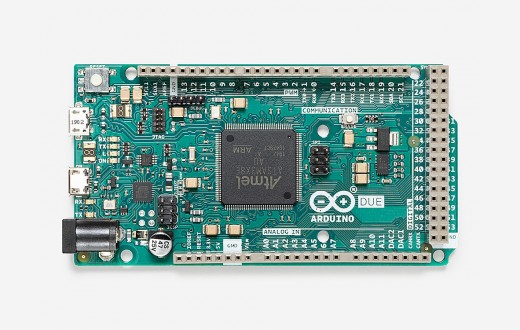 **Figure 3.3: Arduino Due**
The Arduino is an open source microcontroller. This platform is aimed at hobbyists, performers, artists and anyone interested in creating and designing smart and creative objects. With Arduino it is possible to create devices and objects that respond to their environment by means of digital and analog input signals. In our setup, we connect the Arduino (Due) to the PT1000 sensor (see below) to measure the temperature of the Mr. SQUID probe.
Extra information on Arduinos can be found here: https://www.arduino.cc/ .
Temperature Sensor (PT1000)
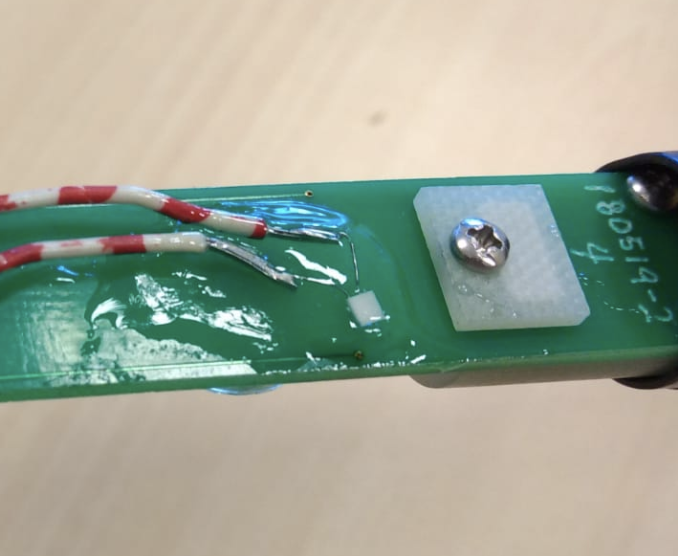
Figure 3.4: PT1000
The temperature sensor is a thermistor that changes its resistance with temperature and it will be used in experiment C to measure Mr.SQUID's critical temperature. It is attached to the back of the PCB on which the SQUID chip is attached.
Schematic
Below you will find a schematic of the setup.
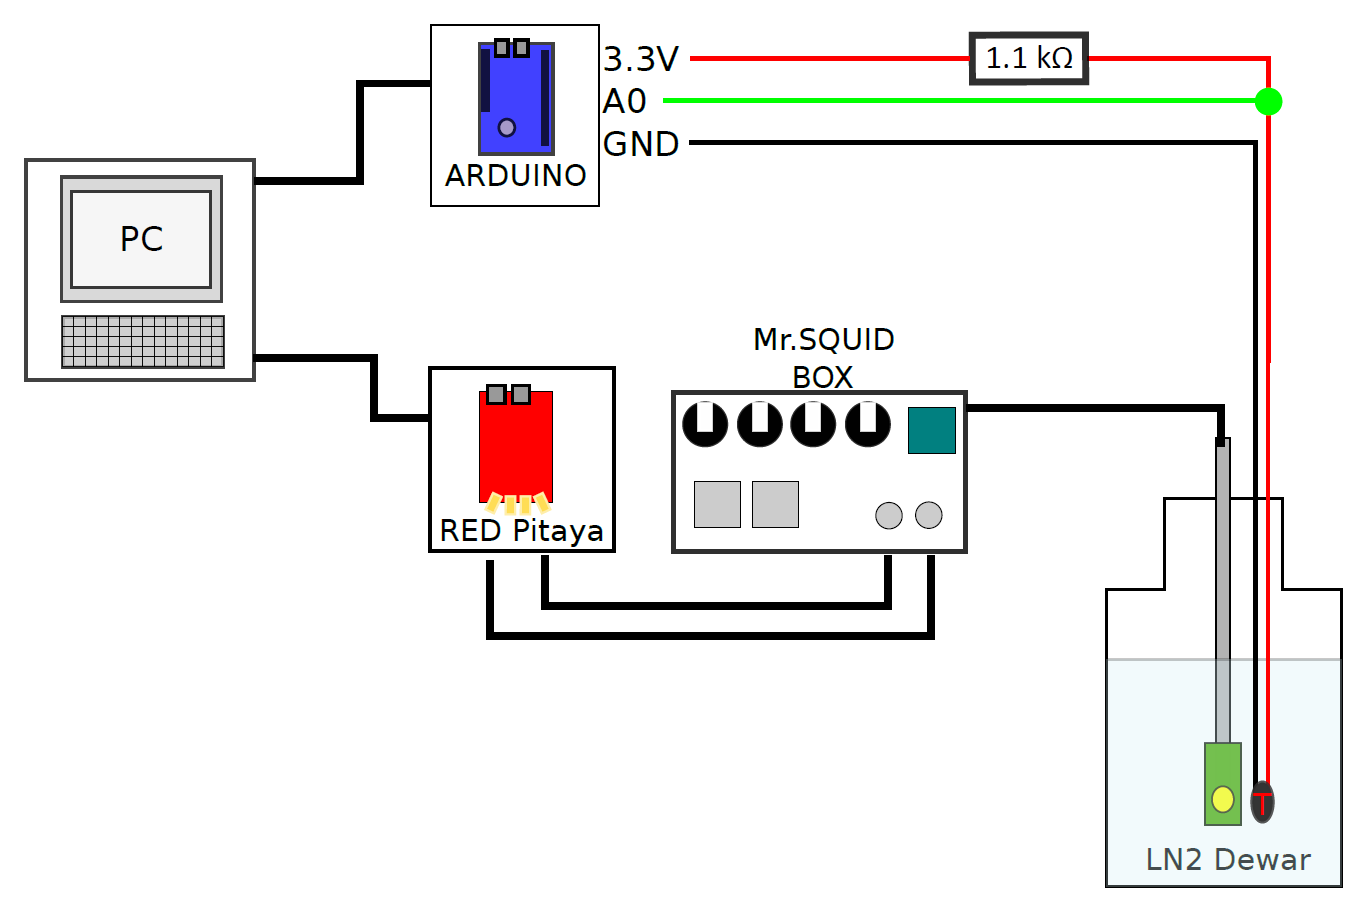
Figure 3.5: Measurement setup where the Red Pitaya and Arduino are both controlled by the measurement PC and sent (receive) data to (from) the Mr. SQUID probe or, respectively, PT1000 temperature sensor.
Here, both the Arduino Due and Red Pitaya are controlled by the measurement PC. The Arduino is connected to a twisted pair cable that goes down the dewar, which is filled with liquid nitrogen. Here the twisted pair cable is connected to a PT1000, which is placed at the same height as the SQUID probe. Note that a voltage divider (with a 1.1 k$\Omega$ resistor) is placed in the circuit to read out the unknown resistance of the PT1000 sensor.
The input and output port of the Red pitaya are connected to the X and Y port of the Mr. SQUID control box. In turn the Mr. SQUID box sents/receives a signal, via the cable, to the Mr. SQUID probe placed inside the dewar.
Mr. SQUID Low-Noise Control Electronics Box ("Conductus")
This section is meant to give a quick explanation of the procedures for operating the Mr. SQUID probe and the features of the Mr. SQUID control box. These are also explained in the videos inside of the general folder of Microsoft Teams folder.
The Mr. SQUID electronics box is designed to provide all the electronics necessary to observe the basic functions of a DC SQUID. Included is a low-noise amplifier section that amplifies the output voltage of the SQUID (with switch-configurable gains of 100, 1,000 and 10,000; the latter is the factory-configured default setting for Mr. SQUID and already taken into account in the measuring software Gary built), current driver circuits to bias the SQUID and drive the feedback coil, and the switching required for the various functions. An triangle wave test signal (generated by the Red Pitaya) is used to display the SQUID V-I and V-$\Phi$ characteristics in the measuring software. The default frequency is 20 Hz but may be adjusted. For the once who are interested are welcome to look around in the code of the measuring software to see what frequencies are possible.
The front panel controls and connectors on the previous version of the Mr. SQUID electronics control box are shown in the figure below:

Figure 3.6: Front panel of the Mr.SQUID electronics control box
POWER Switch: A Three-position toggle switch that selects power ON to the system (up), power OFF to the system (middle) or test battery (down).
OUTPUT DISPLAY: A two-position toggle switch that selects between a 2-channel oscilloscope display (up) or X-Y display (down).
MODE Switch: A two-position knob that selects between the V-I (left) and V-$\Phi$ (right) modes.
- In V-I mode, the triangle wave test signal is applied across the SQUID bias terminals.
- In V-$\Phi$ mode, the triangle wave test signal is applied to a feedback coil that is inductively coupled to the SQUID.
VOLTAGE Output (X port <-> port 1 of Red Pitaya): A BNC connector providing the amplified voltage across the SQUID. The Mr. SQUID electronics box includes an amplifier circuit that can be configured for a gain of 100, 1,000 or 10,000 using an internal switch. For use with Mr. SQUID, the default factory-configured gain setting is 10,000. Thus, the actual voltage across the SQUID is the voltage at the VOLTAGE output divided by 10,000. (i.e., 1 V at the VOLTAGE output corresponds to 100 $\mu$V across the SQUID).
CURRENT Output (Y port <-> port 2 of Red Pitaya): The CURRENT output signal is the voltage output of an operational amplifier inside the Mr. SQUID electronics box that measures the voltage drop across a 10$\Omega$ resistor through which the current flows.
According to Ohm's Law (I = V/R), the current flowing through this resistor is equal to the voltage across it divided by the resistance, 10$\Omega$. The operational amplifier is configured with a gain of 1,000 so a voltage of 1 V at the CURRENT monitor output corresponds to a current of (1/1,000)/10 = 1/10,000 A or 100 $\mu$A.
- In the V-I mode, the CURRENT output represents the current through the SQUID (the sum of the triangle wave plus the DC bias offset current set by the CURRENT OFFSET control).
- In the V-$\Phi$ mode, the CURRENT output represents the current through the feedback coil (the sum of the triangle wave plus the DC flux offset current set by the Flux Bias control).
AMPLITUDE: Sets the amplitude of the triangle wave test signal in either the V-I or V-$\Phi$ mode. In either mode, use the AMPLITUDE knob to set the width of the test signal sweep. In V-I mode, the triangle wave is applied to the bias (I) terminals of the SQUID; in V-$\Phi$ mode, the triangle wave is applied to the internal feedback coil.
CURRENT BIAS: Applies a positive or negative DC bias current to the SQUID. In the 12 o'clock position, this current is approximately zero. This control is used to apply a DC bias offset current to the SQUID.
FLUX BIAS: Applies a positive or negative DC current to the internal feedback coil, which produces a DC magnetic field that is coupled to the SQUID. In the 12 o'clock position, this current is approximately zero. This control is used to modulate the critical current of the SQUID manually by the application of an external magnetic flux produced by the current in the feedback coil.
The rear panel of the Mr. SQUID control box is shown in the figure below:
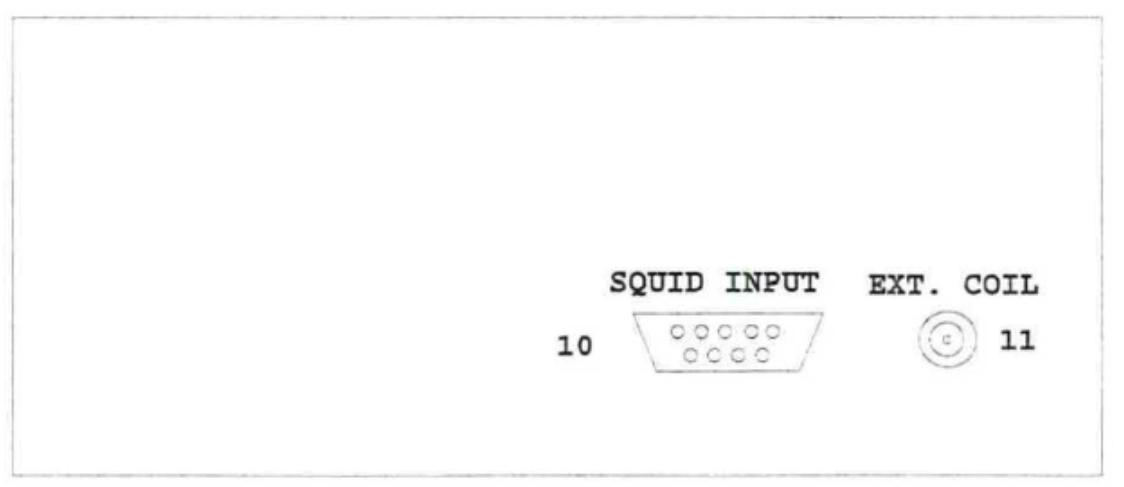
Figure 3.7: Back panel of the Mr.SQUID electronics control box
POWER: A five-pin DIN socket for the external $\pm$12 VDC power supply (or optional battery pack, which is used in this setup!!).
PROBE: Nine-pin DB-9 socket for connections to the Mr. SQUID probe.
EXT INPUT: BNC connector to couple an external voltage signal to the external feedback coil on the Mr. SQUID chip. A MODE switch inside the Mr. SQUID electronics box (accessible by removing the top cover) selects whether this signal is routed directly through a 100 mA fuse at location F1 inside the box to the external feedback coil on the Mr. SQUID chip (switch position DIR) or is converted to true differential using a buffer amplifier and then routed to the feedback coil (switch position BUF). The current output from the buffer amplifier (i.e., the current applied to the external feedback coil) is 100$\mu$A/V. The buffered configuration is the default set at the factory. (NOT NEEDED FOR THE EXPERIMENTS!)
Experiments
Goal:T he goal of this experiment is too cool down the MR.SQUID probe and to observe the flow of a supercurrent, that is the zero resistance flow of cooper pairs when the probe is superconducting, by looking at the IV curve of the SQUID.
For each of the core experiments, make sure you do the following before you start:
- Read the experimental procedure below
- Watch the associated video
- Read and think about the things listed under "Things to think about"
In addition, if you have time, we encourage you to think about your own ideas.
Core Experiment 1: The superconducting IV curve
Experimental procedure
Open the Mr. SQUID software as shown in the videos in Teams
Confirm that the Mr. SQUID control box is turned on, set to V-I and Oscillations (not X-Y). Before you start adjusting and find the sweet spot for your IV curves, place the knobs flux bias, current bias and amplitude in the 12 'o clock position.
Confirm that the Red Pitaya is connected to the PC and to the MR. SQUID control box at the X and Y port.
Double check if the Arduino is seen by the PC. Go to the Arduino software on the Desktop. Go to tools/port and double check if it is set to "COM7(Arduino Due (programming port))". If not double check the USB cable in the Arduino.
Check if the Nine-pin DB-9 cable is plugged in and goes from the Arduino to the rod with the probe.
Check if the Mr. SQUID probe is covert by a magnetic shield (black metalic tube) and aluminum foil (for electric shielding). When the aluminum foil is already covering the probe DO NOT remove it! If you want to have a better look at the probe, you can find a spare probe in the room. In addition, we posted micrographs of the probe in the General channel of Teams.
Before lowering the probe into the liquid nitrogen, start up the SQUID measurements software as shown in the videos. Take an V-I trace (IV live display cell).
Now it's time to cool down Mr.SQUID: At this point you should already have received the liquid nitrogen. Put on the goggles and cryogenic gloves. Carefully (as shown in the videos) move the dewar to the designated place near the measurement equipment. After this the probe can be slowly dipped inside of the dewar.(Fig. 3.8)
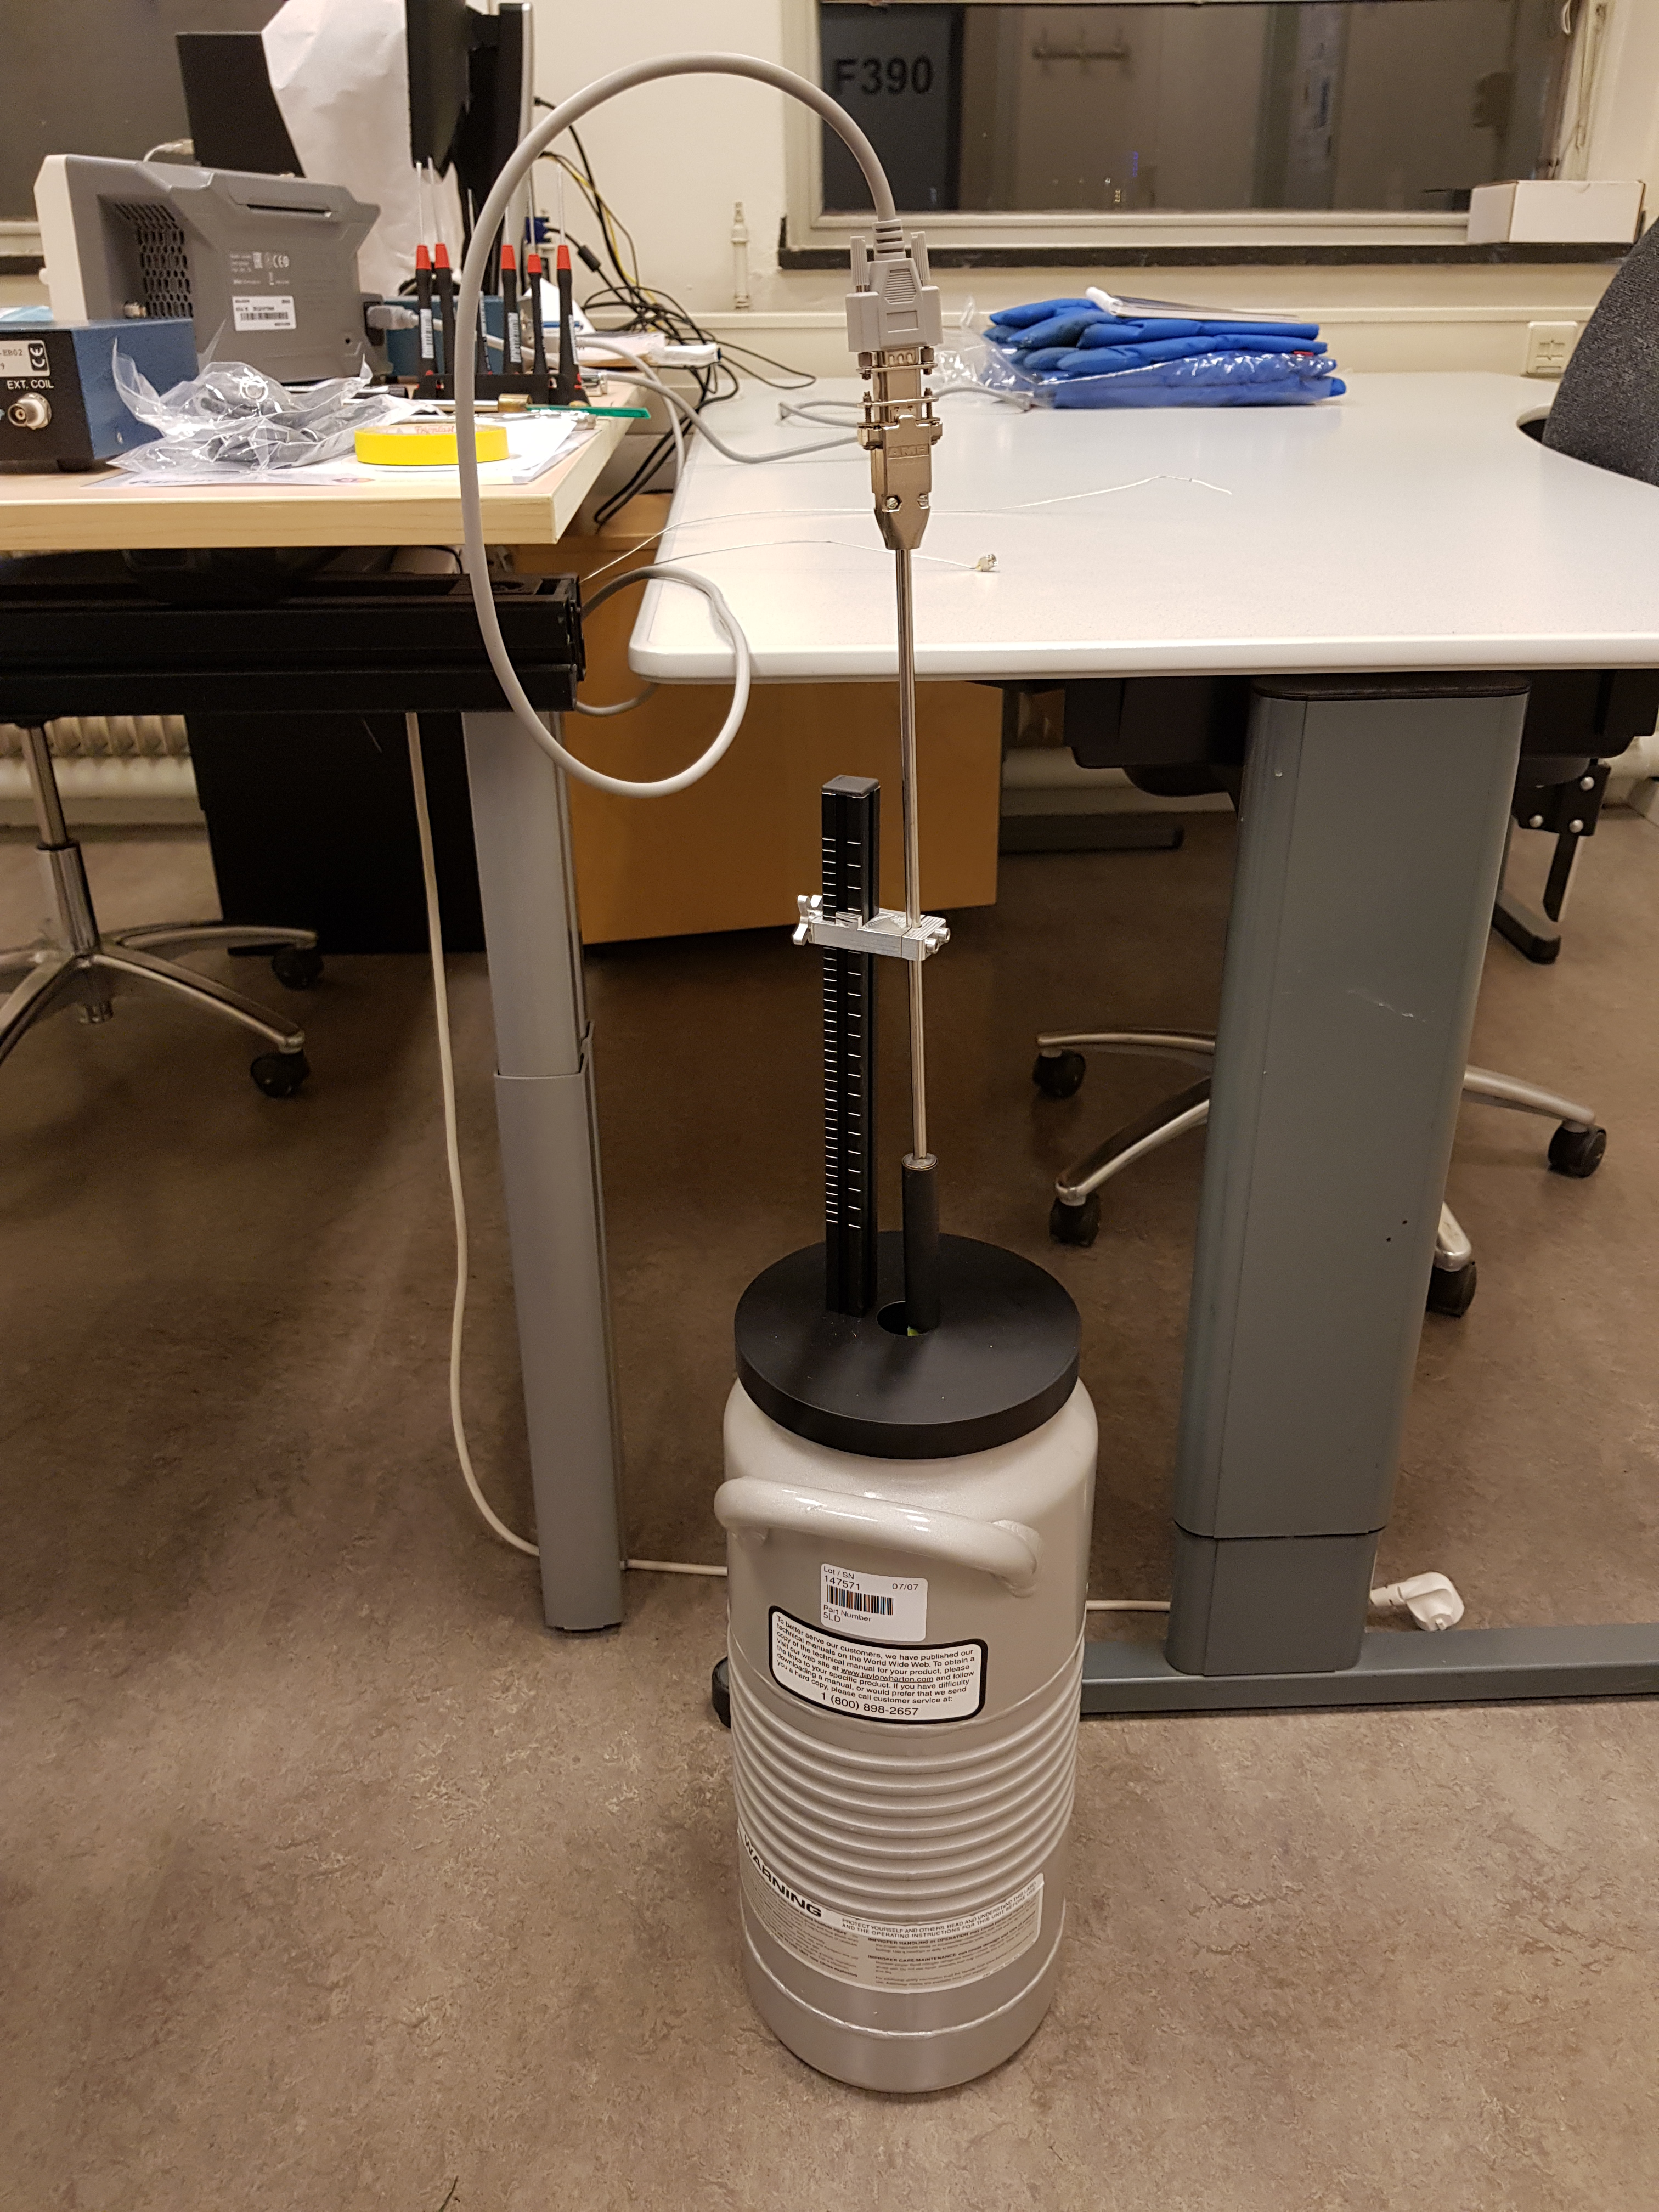
Figure 3.8: Photo of the measurement setup
- The V-I curve should appear on your IV live display in the Jupiter Notebook. The CURRENT BIAS can be used to adjust the offset of the trace, if necessary, and the FLUX BIAS can be adjusted to maximize the critical current. Answer all other questions following question B. A typical Mr. SQUID V-I curve is shown in the figure below:
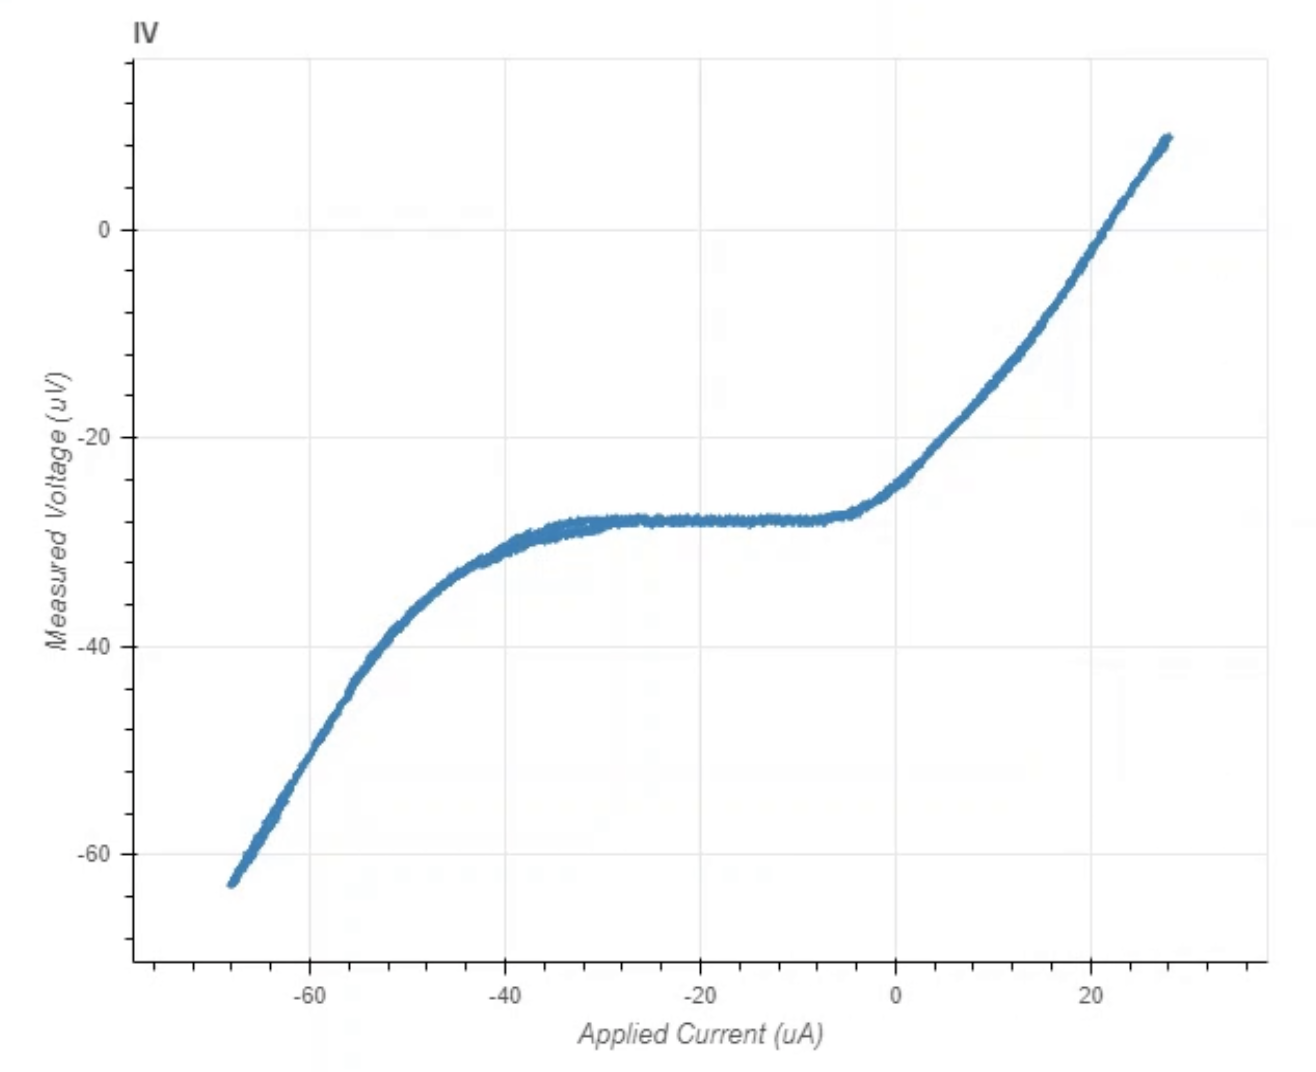
Figure 3.9: A typical Mr. SQUID V-I characteristic measured with the probe from this practicum.
Things to think about
What is the resistance of the SQUID at room temperature?
What is the resistance of the SQUID at 77K?
- This is of course a bit of a trick question! If we interpret the resistance as the slope of the curve, then the SQUID has a resistance that depends on the current flowing through it!
- There are two extreme limits in which it looks "pretty straight: (i) at very low currents, the IV curve is (nearly?) a flat horizontal line, and (ii) at very high currents (you may need to turn up the "sweep output"
When the probe is in the superconducting state, how low is the resistance of the SQUID? What is the value of this resistance? To what degree of accuracy can you determine this from your measurements? (ie. what is the error on the number you can extract?)
What was the measured critical current? What method do you choose to determine the critical current from your IV curve? Can you (quantitatively) estimate the error on the critical current using your analysis method?
P.S. Don't forget to save all your plotted curves! It is very easy, just push a button! It is better to have too much data that not enough!
Core Experiment 2: The superconducting transition
Goal:The goal of the experiment is to measure resistance of the of the Mr.SQUID probe at low bias (< 20 $\mu$A) currents as a function of temperature to produce a resistance vs temperature $R(T)$ curve. From this, you will then analyse the data to estimate estimate the critical temperature of the superconductor used in the Mr. SQUID probe.
Note that the R vs T software works in the following way:
- It continuously measures the IV curve and displays it in the top left panel
- For each IV curve, it tries to calculate the resistance by performing a least-squares fit to a straigh line. If you IV curve looks like a stright line (which should be the case for sufficiently low "AMPLITUDE" settings and the correct choice of the "BIAS" setting), then this will give a good estimate of the resistance of the SQUID for small current excitations.
- After the specified "delay" time, it will measure the resistance of temperature sensor, translate this into a temperature reading based on the calibration of the sensor, and save this and the calculated resistance from the IV curve to a new line in the data file
- In addition, there are extra columns in the data file that include the average, and peak-to-peak, currents and voltages of the IV trace used for calculating the resistance. These can be useful later for debugging what happened in your experiment: in particular, the Iptp (peak-to-peak current bias) is a good way to check what setting you had on the "AMPLITUDE" knob.
Experimental procedure
- After having measured a IV curve, reconnect the temperature sensor cable and slowly start to remove the Mr. SQUID probe from the dewar (as shown in the videos). After you made sure there's no liquid Nitrogen leaking out of the aluminum foil socket, place the probe + rod on the table. Start the temperature trace recorder software and put the measurement delay (s) to 0. For more information look at the video in Teams! Make sure you start the trace on time so the temperature will rise from a equilibrium low (liquid nitrogen) to equilibrium high ($T_{Room}$) temperature point.
* Important: **Make sure that you use a low enough ramp current, and that the current offset is near zero!**
    * The software works by measuring an IV curve, fitting the data to a straight line, and then recording the slope of that line as the resistance for that measurement
    * It does *not* do anything to make sure that the data it is fitting is a straight line
    * For low temperatures, the IV curve is only a stright line for very low bias currents, where it is below the critical current
    * At high temperatures, although the probe acts a resistor, it has a much larger resistance. Here, you can run into a second problem: at high enough currents for a large resistor, the voltage amplifier will saturate / start to clip: https://en.wikipedia.org/wiki/Clipping_(audio)
        * If this happens, your data will also no longer fit properly to a straigh line, and the resistance values in your recorded data file cannot be interpreted properly
    * The software does not record the full IV curve at each temperature, but does save the peak-to-peak and average measured voltage and applied currents. You can see an example of how to plot these in the analysis jupyter notebooks. If your dataset shows a PTP current of more than 20-30 $\mu$A, you should be cautious about interpreting data in that case
    * While measuring, you can also see the IV live in the graph of the top left corner
    * **Upshot**: keep the PTP current below 20 $\mu$A and the average current as close as possible to the "plateau" region of the superconducting IV curve during these measurements.
Wait for the probe to reach room temperature (RT) while taking data with the temperature trace recording software.
When the RT is reached, save your data, and push the "Restart data" button to start a new trace.
After restarting the trace, place the probe back in to the liquid Nitrogen dewar. Wait till the temperature reaches equilibrium (temperature of liquid Nitrogen). Don't forget to save the data when you're done!
Repeat warm up and cooldown five times for good statistics.
It takes a long time to warm up all the way to room temperature. It is good to take one measurement that goes all the way up to say 250K or so. But also feel free also to stop early, heat it all the way back up the RT with the hair dryer, and then dip it back down again. This is particularly useful if you want to take some careful datasets trying to warm up slowly through the transition temperature.
Things to think about
How do you chose to extract the superconducting transition temperature from your R vs. T data?
Does your measurement agree with what is expected for a YBCO superconductor? The Mr. SQUID user manual mentions that the critical temperature of the probe should be "approximately 90K". Is that similar to what you find if you do some searching to find what the expected YBCO transition temperature is?
Do you see a difference of the extracted transistion temperature for warmup and for cooldown traces? Which one do you trust more? For this, it use useful to combine all you measurements in a single R vs T graph.
Do you extract a different transition temperature if you repeat the warmup procedure multiple times? Why do you think that this is? Which one do you trust the most? For this, it is useful to combine all your warmup traces in one graph and then zoom in around the transition temperature.
Does the IV curve of the superconducting SQUID change when you plug in the temperature sensor cable? Why? How will this affect your measurements of the critical temperature?
What happens if you do not pick a low enough setting of the "AMPLITUDE" knob during your measurements while you warm up? How will this affect the resistance the software calculates?
Core experiment 3: Quantum Interference
Goal: The goal of the experiment is to observe a typical voltage modulation with magnetic flux and verify that the periodicity of such modulation is one flux quantum. Afterwards we will see how this effect can be used for high precision current detection.
Experimental procedure
Turn down the AMPLITUDE and use the CURRENT BIAS knob to bias the SQUID just above the critical current (at the knee of the V-I curve). This will be the most sensitive point in the curve.
You can now manually modulate the SQUID with the FLUX BIAS. The point on the oscilloscope screen will move up and down in response to changing the FLUX BIAS.
Move the MODE switch to the V-$\Phi$ (right) position. Increasing the AMPLITUDE sweeps the current (different from the current in step 1) through the feedback coil, which produces a magnetic field that couples to the SQUID.
As the AMPLITUDE is increased, a V-$\Phi$ curve similar to Fig. 3.10 should appear on your display (for more information look at the videos in Teams).
The modulation depth is smaller than the voltages you were measuring before, so increase the vertical sensitivity of your oscilloscope, and, if your oscilloscope can be AC coupled, use this mode for the vertical axis. You may also want to tweak the CURRENT BIAS to maximize the modulation depth. Adjusting the FLUX BIAS will allow you to select a region of the V-$\Phi$ curve for observation.
A typical Mr. SQUID voltage-flux characteristic appears in the following figure: Depending upon the particulars of the individual SQUID and coil in your probe, you should be able to see at least four or five oscillations on your output device.
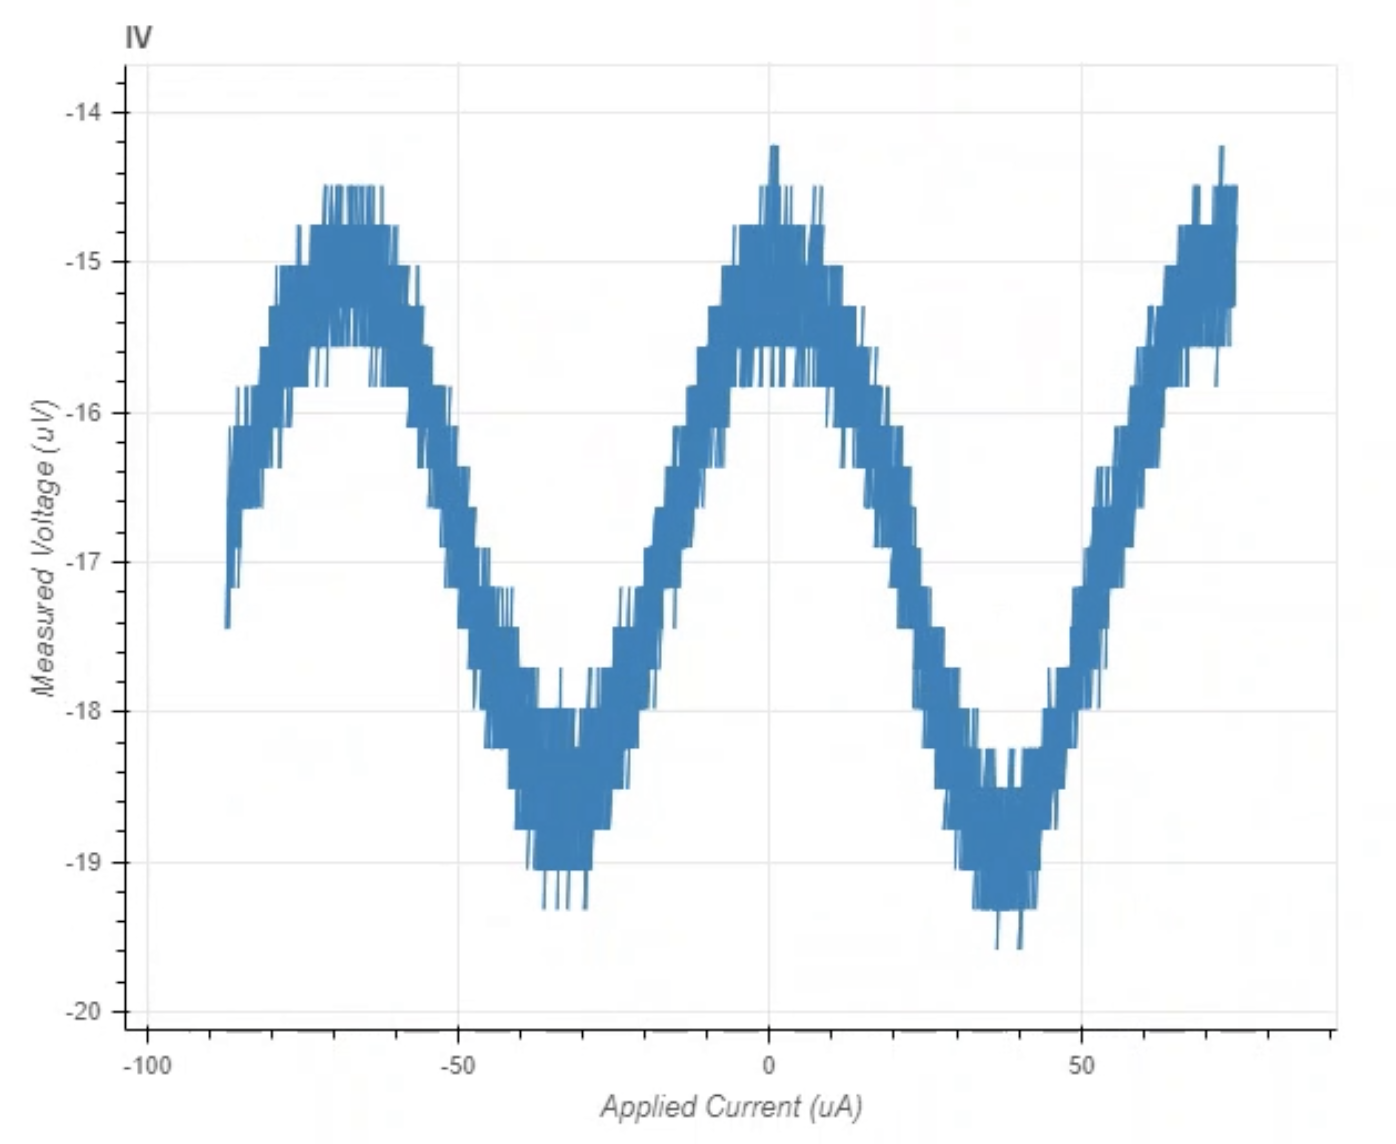
Figure 3.10: A typical Mr. SQUID V-$\Phi$ characteristic. Note that the x-axis now represents the current applied through the flux biasing line that runs alongside the SQUID loop on the chip. To convert this to magentic flux, one needs to know the mutual inductance $M$ between the flux bias line and the SQUID loop.
Things to think about
As you learned reading the theory, it is expected that the critical current of the SQUID should change with magnetic flux by turning the "FLUX BIAS" knob.
- What happens if you make IV curves at different settings of the "FLUX BIAS" knob?
- Can you find the one with the lowest and highest critical current?
- When you are doing measurements keeping the current bias constant and changing the flux, you are effectively moving between these different curves "vertically" at constant horizontal positions on your graph
What happens if you change the "CURRENT BIAS" through SQUID and repeat flux sweep? Do you still see a flux-dependent measured voltage? Why / why not? Can you explain this referring to your IV curves for different flux offsets?
What is the noise of your curves in flux-sweep mode? Is the noise lower at low or high values of "CURRENT BIAS"? If you adjust "CURRENT BIAS" so that you see oscillations, does the noise depend on magnetic flux?
Optional extra experiments: Your own ideas?
We encourage you to have a look come up with ideas of your own experiments, either based on extensions of the three core experiments above, by reading the Mr. SQUID user manual, by looking around online about superconductivity and Josephson junctions, or ideas you may have yourself.
If the core experiments are completed and analyzed before the intermediate meeting, then we encourage you to formulate ideas for trying these out on Day 3.
For this, it is useful to think about the following:
- What do you want to learn in the extra experiments? Is there a question you want to answer? Or is there an idea you want to try?
- What specific procedure do you plan to follow to try to answer your questions or test out your ideas?
- What are your expecations of what might happpen?
- How will you confirm if your expecations are correct or not?
Shutting down the setup when you are done
When you are done, please make sure to turn off the power switch of the MrSQUID "Conductus" box so that the batteries do not drain.
You can turn off the monitor, but DO NOT turn off the computer. If you turn off the computer, you will not be able to connect to it remotely: this can be useful if you want to use the Jupyter server on the computer there to plot and analyze your data. Also, the computer must be on so that we as supervisors can to connect to it remotely to implement software updates.
You can leave the liquid nitrogen in the dewar to boil off naturally.
Analysing your data
In the folder for your round, there are Jupyter notebook provided to help you plot and analyze your data:
Plot all my data: This is a simple notebook you can copy into the folder where your data files are stored. It contains one line of code that will automatically generate "default" plots for all the datafiles you have measured.
File format documentation and plotting routines: This notebook contains example code that shows you how to load the data from the files into data arrays in python. It also documents the contents of the different columns in the data files that are saved.
You can find the code for these as well here in our public "git" repository:
In the repository, we will also add additional notebooks which you may find useful. For example, we recently added an "advanced analysis" notebook that shows you how to average the data in the IV and I-Phi datasets to get lower noise in your plots.
Accessing your data remotely
As long as nobody ever turns the computer off you should be able to access the computer via remote desktop (see instruction videos).
Your data should also be synchronised to a server in Gary's group. You can then download the data from the folder of your round at any time using this link:
Literature
J. Bardren, L. N. Cooper and J. R. Schrieffer, "Theory of Superconductivity", Physical Review, Vol. 108, N.5, pp.1175-1204, December 1, 1957
Barone and G. Paterno, "Physics and Applications of the Josephon Effect", John Wiley and Sons, 1982
J. Clarke and A. I. Braginski, "The SQUID Handbook", John Wiley and Sons, Vol I, 2005.
R. W. Simon, M. J. Burns, M. S. Colclough, G. Zaharchuk and R. Cantor, "Mr.Squid User's Guide", STAR Cryoelectronics, LLC 25 Bisbee Court, Suite A Santa F, 2004
Aviv, "SQUIDS - Superconducting Quantum Interference Devices", University of Negev, 2008
Feynmann lecture notes on Superconductivity